Recent News, Price Trends, and Market Sentiment
ZORA hit the scene in spring 2025 on the Base network, kicking things off with a retroactive airdrop that caught plenty of attention. Marketed as a “memecoin for fun” without any governance rights, the token saw some wild early price action—sharp spikes followed by equally dramatic drops as traders started questioning what it was really worth and how tokens were being distributed. Big names like Coinbase Ventures and Base threw their weight behind marketing efforts, which pumped up the hype but also raised eyebrows about how transparent everything really was. Meanwhile, the NFT and creator economy projects that ZORA is built around are still chugging along, with decent on-chain activity from integrations and creator tokens keeping things moderately busy.
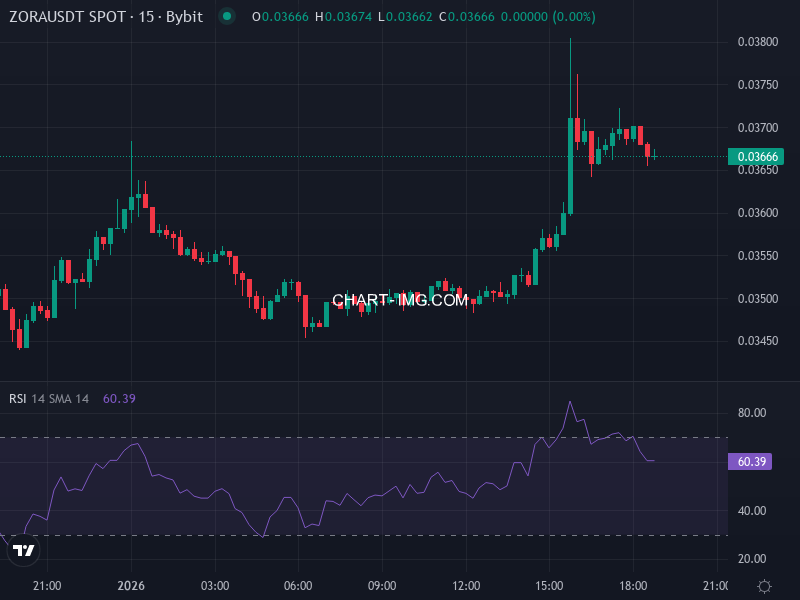
Looking at the numbers, ZORA currently has about 4.47 billion tokens in circulation out of a total supply of 10 billion. Recently, the price has been bouncing around in the $0.037 to $0.040 range, putting the market cap somewhere between $180 and $220 million. That’s a long way down from the all-time high near $0.145. The 50-day moving average is sitting well above where the price is now, which isn’t a great sign. Most sentiment indicators are pointing to bearish or neutral territory, though trading volume does jump whenever there’s news about the ecosystem.
Key Technical Indicators and Levels
If you look at the technicals, ZORA’s Relative Strength Index is hovering in the low-to-mid 30s—right on that line between neutral and oversold. That suggests the selling pressure might be easing up, but we’re not seeing strong signs of a turnaround yet. The 50-day moving average is acting like a ceiling right now, keeping the price down and showing short-term weakness. The 200-day moving average is way higher up, confirming that the long-term picture is still pretty bearish.
Support is sitting around $0.032 to $0.035. If the price breaks below that zone, things could get ugly fast, potentially dropping to $0.030 or lower if the broader market hits a rough patch. On the flip side, resistance is clustered around $0.045 to $0.050. Breaking above $0.050 with solid volume could open the door to $0.060 or higher, but that’s more of a best-case scenario at this point.
Short-Term and 6-Month Price Predictions
Over the next few days to weeks, ZORA will probably keep bouncing between $0.035 and $0.045, with that $0.045 level proving tough to crack without some real catalyst. Given where the RSI and moving averages are sitting, there’s a real chance we could see a dip back to $0.030 if momentum stalls out. Some forecast models are predicting a drop to around $0.0299 within the next month—that’d be roughly a 25% decline from current levels.
Looking three to six months out, assuming nothing goes seriously wrong, a gradual climb back toward $0.055 to $0.070 isn’t out of the question. But that would need consistent good news—new creator tools, fresh exchange listings, actual utility upgrades—paired with renewed confidence from investors. Without those catalysts, the price could easily stay stuck below $0.050 or drift lower toward the $0.025 to $0.030 support zone.
Catalysts to Watch
What could push the price up? New utility for content coins and creator tools, deeper integration with the Base ecosystem, listings on major exchanges (especially in high-volume markets), and whale buying activity. On the downside, watch out for regulatory heat, scheduled token unlocks flooding the market with new supply, community frustration over transparency issues, and whatever’s happening in the broader crypto market. If the price breaks through that $0.032 to $0.030 support zone, it could trigger a cascade of stop-losses and send things spiraling downward.