## Recent Developments & Market Sentiment
The ZORA token has been catching some serious momentum lately, thanks to getting listed on big-name exchanges like Robinhood and Upbit. These listings brought in a flood of trading activity and put ZORA on a lot more radars. What’s interesting is that exchange reserves have been dropping at the same time, which usually means the bigger players are quietly stacking up. All of this lines up pretty well with ZORA’s growing presence in the creator economy and SocialFi world.
That said, it’s not all sunshine and rainbows. Token unlocks have hit the market a few times, and each one brought some selling pressure that you could feel. Plus, ZORA’s still exposed to whatever happens in the broader crypto market—and let’s be honest, things have been pretty choppy. When you look at the technicals, moving averages and Fibonacci levels are showing some important levels being poked and prodded right now. If ZORA can’t hold its ground at key support areas, we could see momentum flip bearish pretty quickly. On the flip side, the accumulation we’re seeing and actual platform usage point to real upside potential. It’s a mixed bag, which means staying disciplined and cautiously optimistic makes sense right now.
At the moment, ZORA’s sitting at around $0.04785962, up about 2.39% over the last 24 hours. That’s a modest bump in the right direction, but we’re still well below the resistance zones that mattered during previous rallies. And with the broader altcoin market stuck in what’s being called “extreme fear,” sentiment-driven price swings could pop up without much warning.
## Chart Indicators & Key Technical Levels
Looking at the chart, a few technical patterns really stand out:
### Support & Resistance Zones
There’s a solid support floor hanging around the $0.044–$0.045 area. This zone has caught the price during recent dips and held things together. If that breaks, the next real support we’d be looking at is down near $0.035—a level that lines up with earlier lows and some psychological round numbers. On the upside, resistance is pretty clear between $0.055 and $0.065. ZORA’s tried to push through there before and gotten slapped back down. If it somehow makes it past that, there’s another tougher resistance band closer to $0.080–$0.090, where previous big rallies ran out of steam.
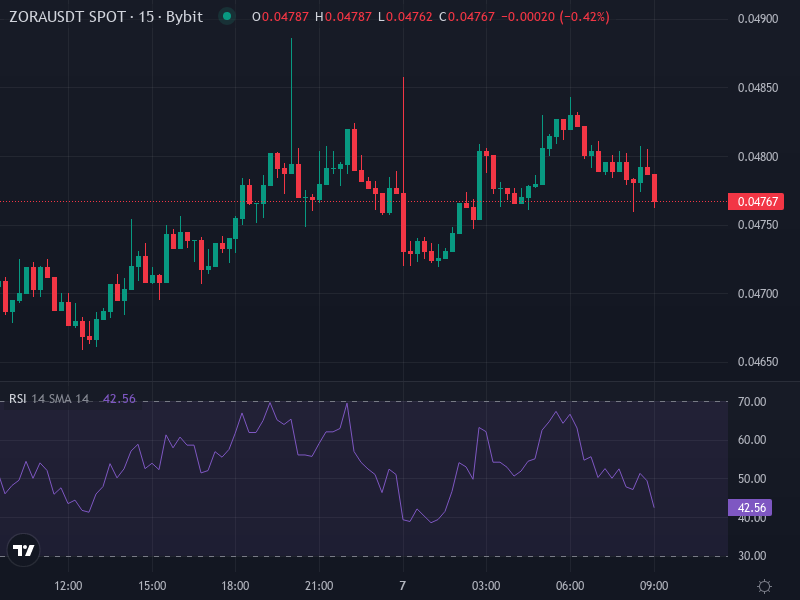
### Momentum Indicators & Trend Signals
The MACD is starting to show what looks like a small bullish crossover, which could signal building momentum if it holds up. The RSI isn’t screaming overbought yet, but it’s creeping up toward the middle range and would signal real strength if it pushes above 60. Volume’s been a bit all over the place—we’ve seen some upticks that matched price gains, but nothing close to the kind of volume we saw during past breakouts. That tells me there’s not quite full conviction from traders yet. If volume starts to dry up, any upward movement could fizzle out pretty fast.
### Supply Unlocks & On-Chain Pressure
ZORA has some token unlock events coming up—basically large batches of tokens going to the team, treasury, and early backers. These can be pretty disruptive. We saw it happen back in late November when an unlock created noticeable downward pressure. Keeping an eye on exchange reserves, wallet flows, and whether this new supply gets absorbed or dumped will be crucial for figuring out what happens next in the short term.
## Probable Scenarios & Price Forecast
With ZORA trading around $0.0479 and bouncing around these technical zones, here’s how things could play out:
### Bullish Case
If ZORA manages to stay above that $0.045 support level, builds up some real momentum with heavier volume, and catches a positive catalyst—maybe more integrations, growing creator adoption, or another exchange listing—it could make a run at that $0.055–$0.065 resistance zone. If it actually breaks through there with conviction, we could be looking at a push toward $0.080–$0.090. That higher target would probably need some help from the broader crypto market turning bullish, or something really exciting happening in ZORA’s own ecosystem—like Solana integration or a major product drop.
### Neutral / Consolidation Case
If there’s no major news to shake things up, ZORA might just chop around between $0.040 and $0.060 for a while. This kind of sideways action would reflect a standoff between long-term believers accumulating and short-term traders taking profits. That $0.044–$0.045 support will probably get tested again, and if it bounces from there, we’d likely see a drift back toward mid-range resistance. Whether this consolidation ends with a breakout or breakdown will come down to what volume and MACD are doing when the moment arrives.
### Bearish Case
If support around $0.044 gives way, ZORA could slide down toward the $0.035–$0.030 zone pretty quickly. Things that could trigger this include sour market sentiment overall, heavy selling from those unlock events, or whales losing interest. In that scenario, even trying to climb back to $0.050–$0.055 becomes a tough fight, with resistance feeling a lot heavier if the bears take control.
—
**Final Insight:** ZORA’s current price looks like it might be in the early stages of a recovery, but it’s still too early to say for sure. The key levels to watch are $0.045 on the downside and around $0.055 above. Volume, moving averages, and what’s happening with supply on-chain are the things that’ll tell us whether ZORA can break out of this consolidation or gets stuck spinning its wheels.