
Recent Fundamental & News Developments
Zama is making waves as a privacy-layer protocol that leverages fully homomorphic encryption (FHE). The project recently dropped its $ZAMA token through a public on-chain auction that encrypted more than $121 million in value—basically the first real-world demonstration of FHE at scale on Ethereum mainnet. There’s been some solid momentum around exchange listings too, with platforms like European exchange Bitvavo rolling out flexible staking at roughly 10% APY without any lockup periods. That’s a nice touch for anyone wanting exposure without tying up funds. Looking ahead, Zama’s 2026 roadmap promises integration with Shibarium and upgrades to confidential smart contracts, which should keep the narrative interesting for the long haul.
Technical Indicators: 4-Hour Timeframe
Here’s where ZAMA/USDT stands right now based on live data:
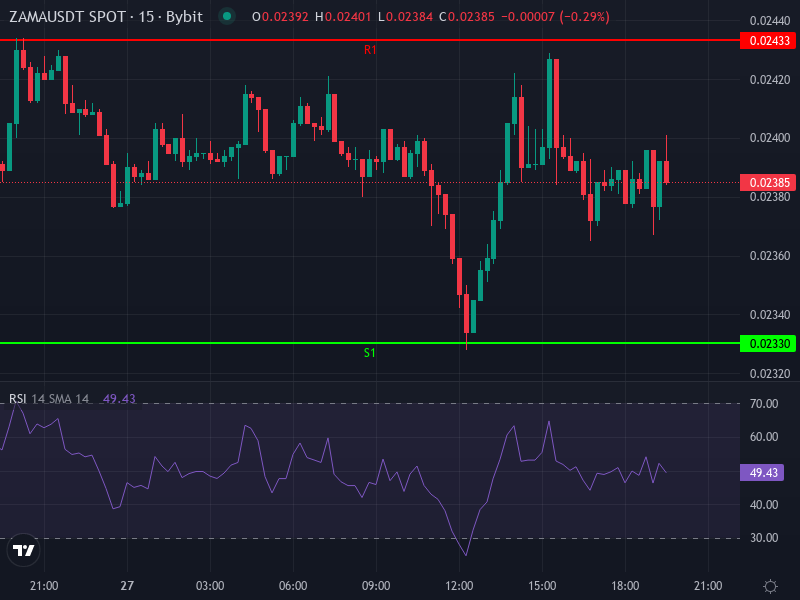
- Price: sitting at about 0.023858 USDT
- RSI (4-hour): hovering around 52.66 — pretty neutral territory, not screaming overbought or oversold
- MACD (4-hour): MACD line at 0.0002131 is trailing below the signal line at 0.0003063, giving us a negative histogram of roughly –0.0000931. That’s pointing to some bearish vibes in the short term
- SMA / EMA (4-hour): SMA at approximately 0.02355 USDT and EMA around 0.023598 USDT. Price is hanging just above both, so there’s a bit of support from these moving averages
Pivot Points & Momentum
Looking at the daily chart, here’s how the pivot levels break down:
- Pivot (P): 0.0237967 USDT
- Resistance 1 (R1): 0.0243333 USDT; R2: 0.0248267 USDT; R3: 0.0253633 USDT
- Support 1 (S1): 0.0233033 USDT; S2: 0.0227667 USDT; S3: 0.0222733 USDT
The daily rate of change is sitting positive at around +3.43%, which suggests a bit of upward momentum in the near term.
Price Prediction & Scenarios
Bullish Case
If things hold steady, ZAMA could climb back above that pivot around 0.02380 and take a shot at R1 near 0.02433. If we get some fresh catalysts—think partnership announcements or integration updates—there’s potential to push toward R2 around 0.02483, maybe even testing R3 at 0.02536. For this to play out, you’d want to see the MACD flip bullish and 4-hour candles consistently closing above those moving averages.
Bearish Case
On the flip side, if selling pressure keeps building—MACD stays in negative territory and price slips below S1 at 0.0233033 USDT—we’re probably headed toward S2 around 0.02277 USDT. Break below that, and S3 near 0.02227 USDT comes into play. If the RSI on the 4-hour drops under the 45-50 range, that would pretty much confirm sellers are in control.
Neutral / Consolidation Case
There’s a decent chance ZAMA just chops sideways between S1 and R1—roughly 0.02330 to 0.02433 USDT. In a range like this, volume tends to dry up and the MACD histogram stays flat. This kind of consolidation usually sticks around until something shakes things up, whether that’s roadmap news, regulatory clarity, or a broader market shift.
Final Insight for Traders
Right now the signals are pretty mixed. MACD and RSI aren’t giving us a clear direction, and price is just hanging around those moving averages. That means the risk-reward setup favors patience—wait for some confirmation before jumping in with size. If you’re looking to play short-term swings and don’t mind being a bit aggressive, entries near S1 with a tight stop below S2 could work, targeting R1-R2. For the more cautious crowd, it makes sense to wait for a breakout above R1 or a solid volume surge that actually validates a trend change.