Recent Developments & Market Context
YieldBasis (YB), a DeFi protocol created by Curve founder Michael Egorov, has been turning heads lately with its incredibly fast TVL growth and innovative features designed to eliminate impermanent loss in automated market makers through a 2× leveraged position using crvUSD. The jump from an initial $6 million TVL to an impressive $300 million in less than a month shows just how aggressively governance has expanded its credit line and deepened its ties with Curve DAO. The partnership is already bearing fruit, with key revenue streams from trading fees and PegKeeper operations bringing in roughly $188,000 for liquidity providers and DAO stakeholders. That said, the main risks to keep an eye on revolve around crvUSD’s stability and whether the system can rebalance efficiently when markets get choppy.
On the exchange front, YB has been getting picked up by major platforms left and right—Binance, OKX, BitMart, BigONE, and several others—usually as YB/USDT trading pairs. This expansion is opening up liquidity and giving retail traders easier access to the token. There are plenty of promotions and incentive programs helping to kickstart network effects, though they’re also bringing some short-term volatility as tokens get released into circulation. Market watchers are particularly interested in how the veYB tokenomics (where users lock up their YB tokens for voting rights) and governance participation might limit the circulating supply and ease some of that sell-side pressure from emissions.
Technical Indicators & Short-Term Price Outlook
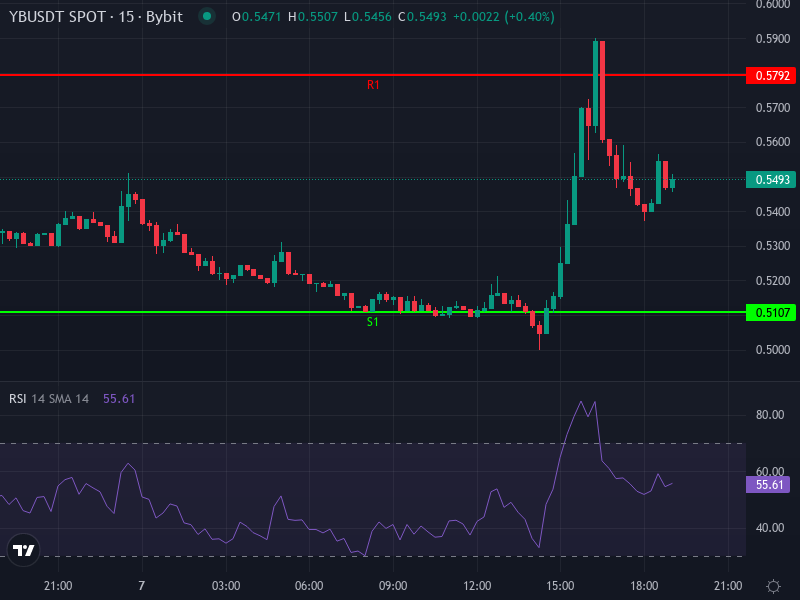
Right now, YB/USDT is trading around 0.5489 USDT, up about +2.73% over the past 24 hours. Looking at the 4-hour chart, several key indicators paint an interesting picture of where we might be headed in the short term. The Relative Strength Index (RSI) is sitting near 64.8, which suggests we’ve got some bullish momentum going without being overbought yet. The Simple Moving Average (SMA) is hovering around 0.5046 and the Exponential Moving Average (EMA) is near 0.5128, both pointing to the fact that recent gains are building on solid support levels.
The MACD readings are a bit more mixed, though. The MACD line is sitting just below its signal line, creating a slightly negative histogram (around −0.0025), which suggests we might be a bit overextended and could see some consolidation or even a small pullback in the near term. While the bulls still seem to be in control for now, if the price can’t close decisively above that EMA, we might see it test some support levels. Daily pivot calculations put the central pivot at about 0.5471 USDT, with the first support level at 0.5107 USDT (S1) and resistance around 0.5792 USDT (R1).
Support & Resistance Drilldown
If we do see some consolidation or a pullback, that S1 level around 0.51 USDT becomes really important to watch. If price breaks below that, we could slide down to S2 territory around 0.48 USDT, and the risk increases even more if Bitcoin and the broader crypto market start showing weakness. On the flip side, there’s resistance sitting in the zone between roughly 0.57 and 0.61 USDT. Breaking above R1 and pushing toward R2 would signal a resumption of bullish momentum and potentially indicate longer-term strength for YB.
Forecast Scenarios & Risk/Reward Considerations
Taking everything into account—the technical picture combined with the recent governance-driven growth—the near-term outlook leans slightly bullish. If price can hold above that daily pivot around 0.547 USDT and manage to close above the EMA on the 4-hour chart (approximately 0.5128), we could see a move up toward the 0.58–0.60 USDT range, with potential upside to around 0.62 USDT if volume picks up and sentiment stays strong. On the other hand, if we can’t hold that pivot level, we’re looking at a potential drop down to the 0.50 USDT support level, and possibly even 0.48 USDT if selling pressure really kicks in. The MACD trajectory and where RSI settles will be crucial early warning signs for which way things are likely to move.
Looking further out, the long-term upside really depends on whether YieldBasis can scale its crvUSD credit lines responsibly, keep governance token emissions under control, and maintain smooth operation of its leveraged AMM even when Bitcoin and the broader market get volatile. The main risks to consider include potential regulatory crackdowns on stablecoins and leverage, possible slippage or sudden spikes in borrowing costs, and any hiccups with crvUSD maintaining its peg. For anyone trading this seriously, it’s smart to size positions with these tail risks in mind.