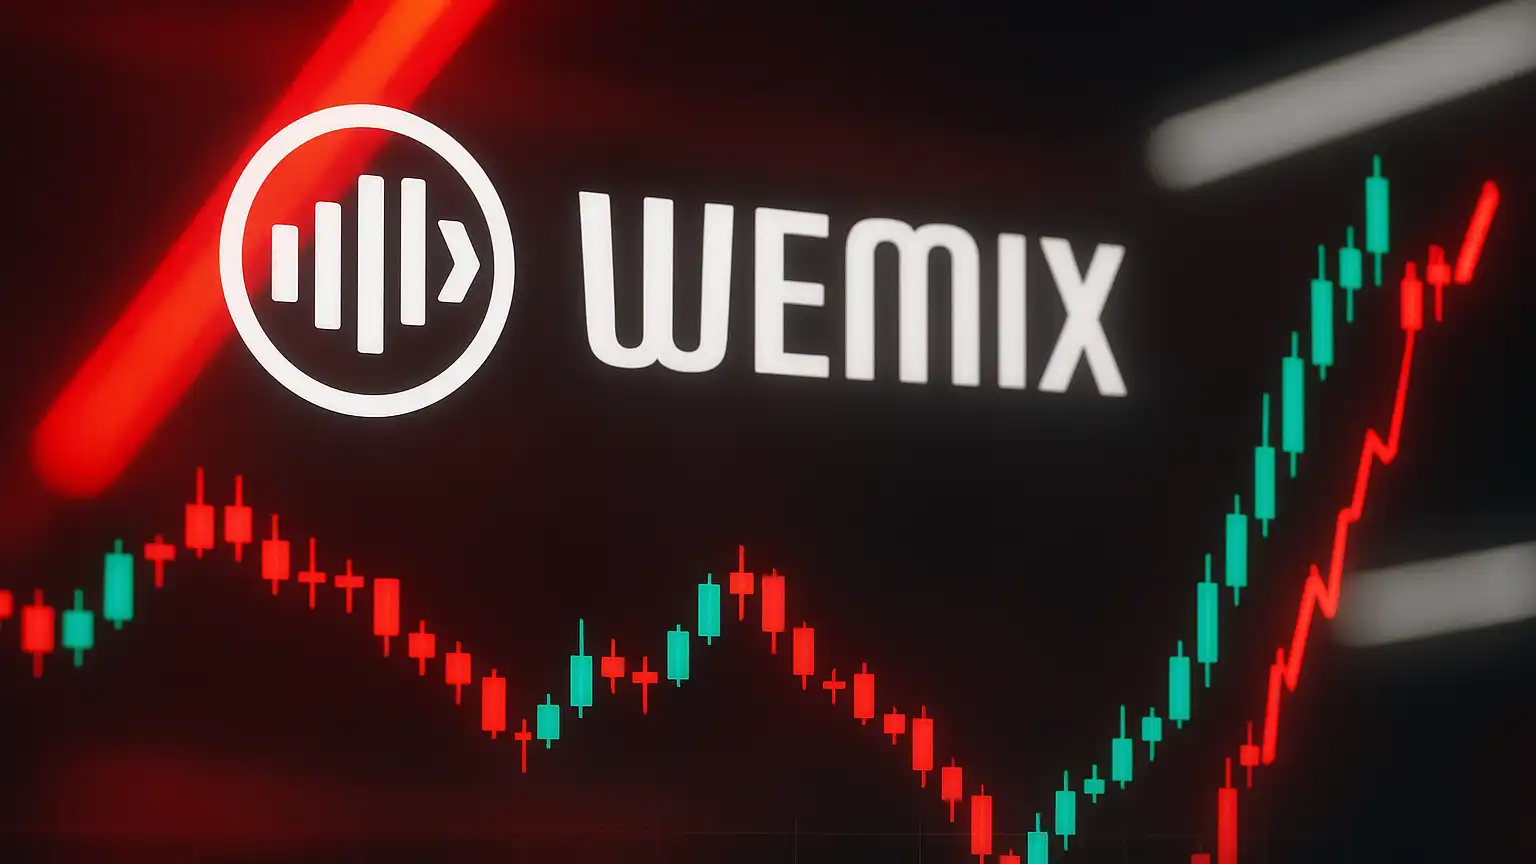
Recent Developments and Market Sentiment
WEMIX is currently sitting at around $0.38095 against USDT, showing a decent 24-hour jump of roughly +5.21%. While that’s nice to see in the short term, it’s worth remembering that WEMIX is still way down from its peak of nearly $24.68 back in late 2021. The token has been through some rough patches lately. Over the summer of 2025, five big Korean exchanges delisted it following guidance from DAXA, which definitely hurt confidence. Earlier in the year, there was also a bridge hack that drained about $6 million from the ecosystem. Both incidents really damaged trust in the project. On a more positive note, WEMIX is pushing forward with GameFi expansion, NFT applications, and they’re planning to roll out new utility features including stablecoins, all aimed at rebuilding value in the ecosystem.
Technical Indicators and Key Levels
Looking at the charts, WEMIX is showing a somewhat mixed to bearish picture right now. The RSI is hovering around 41-42, which suggests mild selling pressure but nothing extreme—it’s not oversold yet. The ADX reading shows moderate trend strength, meaning there’s no strong momentum in either direction at the moment. Above the current price, there’s a thick cluster of resistance between roughly $0.50 and $0.71, where you’ll find multiple moving averages and the upper Bollinger Band stacking up. Below, support looks to be around $0.35 to $0.38, backed by previous bounce points and some visible buying interest. Interestingly, both Stochastics and Williams %R have moved into oversold territory, which could hint at a potential bounce if buyers decide to step back in.
Moving Averages & Moving Momentum
The 50-day moving average is sitting above the current price and trending downward, basically acting as a ceiling. The 200-day moving average is also pointing down, which confirms that the longer-term structure is still bearish. That said, some of the oscillators—like the Stochastic %K and Williams %R—are showing readings that suggest the price might be getting close to oversold levels. This is where you sometimes see a mean reversion bounce. Volatility is still running high though, so any recovery would likely be fragile and could reverse quickly without solid bullish news to back it up.
Price Predictions: Scenarios to Watch
Here’s what the road ahead might look like under different market conditions, based on technical signals and various forecasts:
– Bearish Scenario: If the selling keeps up, WEMIX could drift down toward $0.30 to $0.35. Breaking below $0.35 would likely open up the next support zone around $0.28-$0.30.
– Base Case / Moderate Recovery: Over the next one to three months, a more realistic scenario has WEMIX trading somewhere between $0.45 and $0.60. This would require a clean break above the $0.50 resistance level and some stabilization in the indicators.
– Bullish Upside: If the ecosystem updates—like the stablecoin launch and GameFi momentum—get a good reception, and the broader crypto market stays friendly, we could see WEMIX climbing toward $0.80-$1.00 by year-end. Some longer-term optimistic forecasts even put it in the $1.30-$1.50+ range by 2027, assuming the project can build positive momentum and regain trust.
Final Insight
At around $0.38, WEMIX is basically at a fork in the road. The momentum indicators aren’t screaming “buy” just yet, but those oversold readings do raise the possibility of a short-term bounce. The zone between $0.35 and $0.40 is really important here—holding above it could start to build some confidence and set the stage for a move back toward $0.50. If it breaks below, though, we could be looking at deeper losses. For those looking to trade it, waiting for dips toward support with tight stop-losses makes sense. If you’re thinking bullish, it’s probably smarter to wait until the trend-based metrics actually show some signs of recovery before jumping in.