
Introduction & Recent Market Context
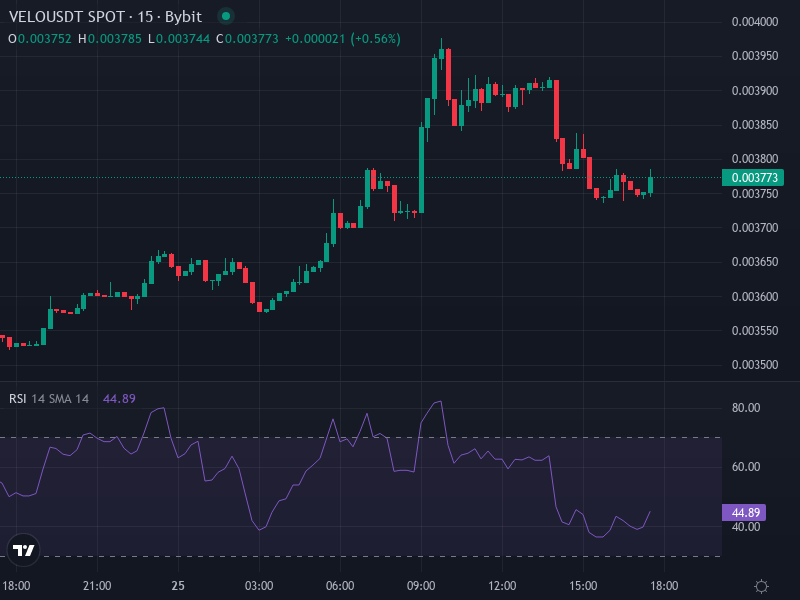
VELO/USDT has had a decent run over the last day, climbing about 6.31% to trade around 0.00376 USDT. That said, you’ll see wildly different prices quoted elsewhere—some sites show it closer to $0.00345 or $0.00360 USD. The discrepancy likely comes down to thin liquidity and pretty wide spreads depending on which exchange you’re looking at.
As for what VELO is actually trying to do, the project is focused on programmable finance, tokenizing real-world assets, and making cross-border payments easier in Southeast Asia. Recently, they’ve been working on their “PayFi” network, adding stablecoin support, and forming partnerships to expand how real-world assets can work across different platforms. These are all decent signs, even if the overall altcoin market has been pretty quiet.
To put things in perspective, VELO is still way down from its all-time high—we’re talking over 99%. But some folks watching the charts think it might be building a bottom after months of sideways movement, possibly setting up for a move higher.
Technical Indicators & Key Price Levels
Support Zones & Chart Structure
Right now, VELO seems to be holding up around the 0.00350–0.00360 USDT range. This area has acted as a floor multiple times recently, with buyers showing up—albeit without huge volume—each time price dips there. If that level gives way, the next place we’d expect support is down around 0.00280–0.00300 USDT, which was a turning point during earlier consolidation phases.
Looking at the chart, there’s a chance we’re seeing a double bottom or some kind of accumulation pattern forming. The RSI and MACD on shorter timeframes are sitting in oversold or neutral territory, which means there’s room for the price to bounce if buyers step in.
Resistance Targets & Breakout Scenarios
On the upside, the first real hurdle is around 0.00420–0.00450 USDT. That’s where recent highs and some Fibonacci levels line up. Push through there with solid volume, and the next stops would be around 0.00550 USDT, then 0.00650 USDT. These levels match up with old consolidation zones and previous swing highs.
If VELO manages to break cleanly above 0.00550–0.00600 USDT and volume picks up, that could flip the trend from sideways or mildly bullish into something more convincing. But for that to stick, you’d want to see short-term moving averages start supporting the price instead of resisting it.
Indicators & Momentum Signals
The daily RSI is hanging out in the middle zone—not too hot, not too cold. The MACD is showing less bearish momentum, which opens the door for a bullish crossover if something kicks things off. On the 4-hour and 8-hour charts, there are a few small bullish divergences happening: price is making lower lows, but RSI and volume aren’t following suit.
The catch? Volume is pretty low across the board. Without a meaningful spike in trading activity, any breakout or reversal won’t have much weight behind it. Until that changes, we’re probably stuck in a range.
Price Forecast & Risk Scenarios
Bullish Case
If VELO holds above that 0.00350–0.00360 USDT support and breaks through resistance at 0.00450, we could see it climb toward 0.00600 USDT over the next few weeks. If the broader altcoin market heats up or VELO drops some big news, 0.00800 USDT isn’t out of the question. Beyond that, though, it’s hard to see much upside without a real shift in volume or a strong tailwind from the crypto market overall.
Bearish Case
On the flip side, if support at 0.00350 USDT breaks down convincingly, VELO could slide to 0.00280–0.00300 USDT. Lose that level—especially with heavy selling—and we might be looking at a drop toward 0.00200 USDT, where longer-term buyers might finally show up. Things that could push it lower include a weak crypto market overall, delays in product rollouts, or regulatory trouble in the regions where VELO operates.
Implications for Investors & Trading Strategy
If you’re looking to trade short-term, the current setup isn’t bad. You could enter around here with a tight stop-loss just under support (around 0.00340) and aim to take profit near that first resistance zone (0.00450–0.00550). Just keep an eye on volume when price tries to break out—it’ll tell you whether the move is real.
For anyone thinking long-term, VELO’s fundamentals—stablecoin work, real-world asset stuff, payments infrastructure—are interesting if they can actually deliver. But they need to show real user adoption and activity to justify the valuation.
Either way, don’t go overboard. VELO is a small-cap coin with thin liquidity, so it can swing hard in both directions. Even with some bullish signals on the chart, the downside risk is real if the broader market turns south. Keep your position sizes sensible and spread your risk.