

Recent Developments & Ecosystem Momentum
VANA has been making some interesting moves lately, trying to carve out its niche where Web3 meets AI. The big news? They rolled out the VRC-20 token standard, which is basically their way of making data-backed assets more trustworthy and transparent. Here’s the thing though – DataDAOs now need to issue tokens that follow VRC-20 rules if they want access to liquidity incentives. No more free VANA handouts, which honestly makes sense if you’re trying to keep things accountable and prevent the token from getting watered down. Right out of the gate, they had over 12 million data points flowing through various active DataDAOs. Pretty solid numbers, especially when you consider how jittery the crypto market has been.
Then there’s the Capella upgrade that dropped in mid-2025 – think faster speeds, tighter security, and better tools for developers. They’ve also got this Vana Playground thing going, which launched back in September 2025 and somehow managed to pull in over a million users who’ve contributed around 12.7 million data points. The idea is to help train actual AI models and let people monetize their data. Now, investors? They’re kind of split on this. Sure, the tech upgrades look promising for the long haul, but those token unlocks – especially that chunky one in June 2025 – have people worried about too many tokens hitting the market and tanking the price in the short term.
Technical Indicator Summary & Current Price Behavior
Right now, VANA is sitting at around $2.8343, which is actually up about +0.3745 over the last 24 hours. Looking at the 4-hour chart, the RSI is hovering near 51.8 – basically right in the middle, not too hot, not too cold. Nothing screaming “overbought” or “oversold” here. The MACD on the 4-hour is just barely above its signal line with a tiny positive histogram, suggesting there might be some upward momentum building, but it’s subtle. The short-term averages paint a similar picture: the 4-hour SMA is chilling at about $2.8147, just under the current price, while the EMA is practically kissing it at $2.8357. What this tells us is that buyers are poking at resistance, but they haven’t really broken through yet.
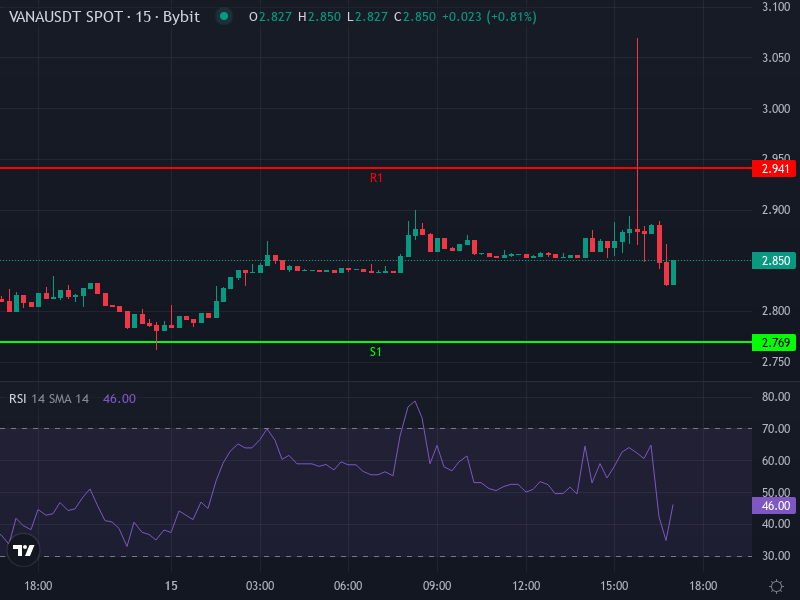
Zooming out to the daily view, the pivot points are showing resistance levels at roughly **$2.941 (R1)**, $3.032 (R2), and $3.113 (R3). On the flip side, support is hanging around $2.769 (S1), $2.688 (S2), and $2.597 (S3). The daily rate of change is showing some slight bearish vibes, but nothing dramatic enough to completely kill the upside potential if buyers decide to show up. Those longer moving averages – the 50-day, 100-day, 200-day – are still providing support in that $2.80-$2.85 range, which acts as a safety net for any dips.
Momentum & Strength Indicators
The 4-hour ADX isn’t particularly strong, which means we don’t have a really solid trend going either way right now. Other indicators like Williams %R, CCI, and ROC are giving mixed signals – some look like they might be setting up for an oversold bounce, others are waving red flags about potential fake breakouts. The daily moving averages on the shorter timeframes lean a bit bearish, but the medium and longer-term ones are more in holding-pattern mode. Volume is something to keep an eye on here – if we don’t see more buying activity, especially as price tests those resistance levels, the upside might stay limited.
Price Prediction Scenarios & Key Levels to Watch
Taking everything into account – the technicals and what’s happening with the project itself – there are basically two ways this could play out over the next few weeks to months:
- Bullish Breakout Scenario: If VANA manages to push past that first resistance at $2.941 and actually holds above the $3.032 level, we could see it testing $3.11 and maybe even making a run at $3.30-$3.50. The catch? We’d really need to see volume come in to confirm this isn’t just a head fake. If this happens, momentum indicators would probably turn more convincingly bullish – think expanding MACD histograms and RSI climbing toward 60-65.
- Bearish or Neutral Consolidation Scenario: If the price can’t break through the near-term resistance and volume stays weak, VANA might drift back down to that $2.77 support level, possibly even testing $2.69. Below that, the $2.55-$2.60 zone becomes really important as a last line of defense. Bearish signals on the daily charts or any negative news – regulatory stuff, competition heating up, more token unlocks – could speed up a move to the downside.
Looking at the recent progress with Capella, the VRC-20 standard, and the traction they’re getting with Playground, plus the current technical setup that’s leaning slightly positive, a move up to around **$3.20-$3.50** seems pretty reasonable over the next month or two – assuming we get some new catalysts and those resistance levels actually break cleanly. If that doesn’t happen, we’re probably looking at sideways action between $2.70-$2.80 while the market digests those upcoming token unlocks and waits for partnership news or other developments.


