
Recent News & Fundamental Catalysts
Trust Wallet Token has been making some interesting moves as we head deeper into 2025, and there are a few key developments worth paying attention to. The team rolled out FlexGas, which is honestly a game-changer for everyday users. Basically, you can now handle transactions and swaps across BNB Smart Chain, Ethereum, Arbitrum, OP Mainnet, Base, and even Solana—all while paying fees in TWT, USDT, or USDC. It’s built on the EIP-7702 standard, which means you get all these benefits without giving up control of your wallet. Pretty smart move when you think about how much people hate juggling gas tokens.
What’s really catching attention is the supply side of things. Trust Wallet claims they’ve burned over 10% of circulating supply since late 2025. When supply gets tighter and usage grows, that tends to create upward pressure on price—assuming demand stays steady or increases.
Then there’s the Binance.US listing that went live in December 2025. U.S. traders can now deposit and trade TWT on the BEP-20 network with a TWT/USDT pair. Listings like this usually bring a wave of new buyers, both retail folks looking to get in early and institutions dipping their toes in through regulated channels.
Technical Indicator Assessment
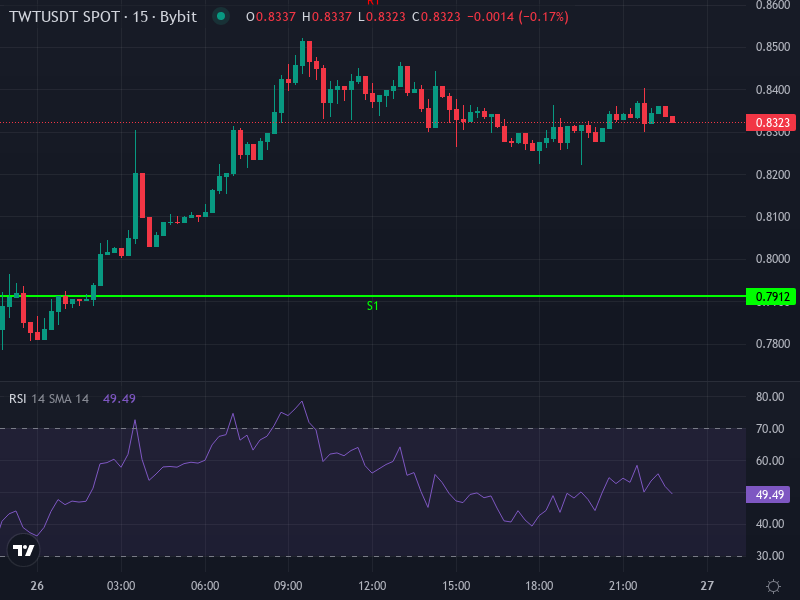
Let’s dig into what the charts are telling us right now across different timeframes:
Current Price: $0.8324
24h Price Change: +5.76%

4-Hour Window:
 - SMA sitting around $0.8278, just under current price → minor upward momentum building.
 - EMA at roughly $0.8308, also supporting the bulls in the short term.
 - MACD Histogram is positive (MACD at -0.00317, signal at -0.00641, histogram +0.00323), showing a fresh bullish crossover.
 - RSI hovering near 51.65 → neutral territory, no overbought warnings yet, room to climb.

Daily Pivot Points:
 Pivot: ~$0.8216
 Resistance 1 (R1): ~$0.8632
 Resistance 2 (R2): ~$0.8936
 Support 1 (S1): ~$0.7912
 Support 2 (S2): ~$0.7496

Longer-Term Picture:
 Daily, weekly, and monthly moving averages (50, 100, 200-period SMA/EMA) are mostly sitting above current price, which tells us the broader trend has been bearish.
 RSI on the daily chart is deep in oversold territory (below 30), which often signals a bounce might be coming if buyers show up.
 ADX is confirming strong trend strength—and right now, that trend is still pointing down.
Price Prediction & Key Levels
So here’s how I’m reading the room when I put all these pieces together—fundamentals, market sentiment, and technicals. TWT has been grinding through a consolidation phase after getting beaten down pretty hard. The oversold signals we’re seeing suggest the sellers might be running out of steam, at least temporarily. Over the next week or two, if support around **$0.80–$0.82** holds and we start seeing volume pick up, there’s a decent shot at a bounce toward the **$0.88–$0.90** resistance zone. If buyers can push through that ceiling, we could be looking at **$1.03–$1.10** by early 2026, assuming the broader crypto market doesn’t fall apart.
On the flip side, if that support at **$0.78** breaks, things could get ugly fast. Next stop would likely be **$0.70–$0.75**, where we’d expect to find stronger buyers waiting.
Scenarios to Watch
- Bullish scenario: Trading volume on Binance.US takes off, FlexGas adoption spreads across Solana, Ethereum, and BSC, and more institutional players start staking or locking up supply. All of that could fuel a breakout above resistance and shift the momentum entirely.
- Bearish scenario: Regulatory crackdowns on utility tokens heat up, the broader crypto market tanks, or volume just doesn’t materialize. Any of those could send TWT sliding further down toward key support levels—or through them if panic sets in.