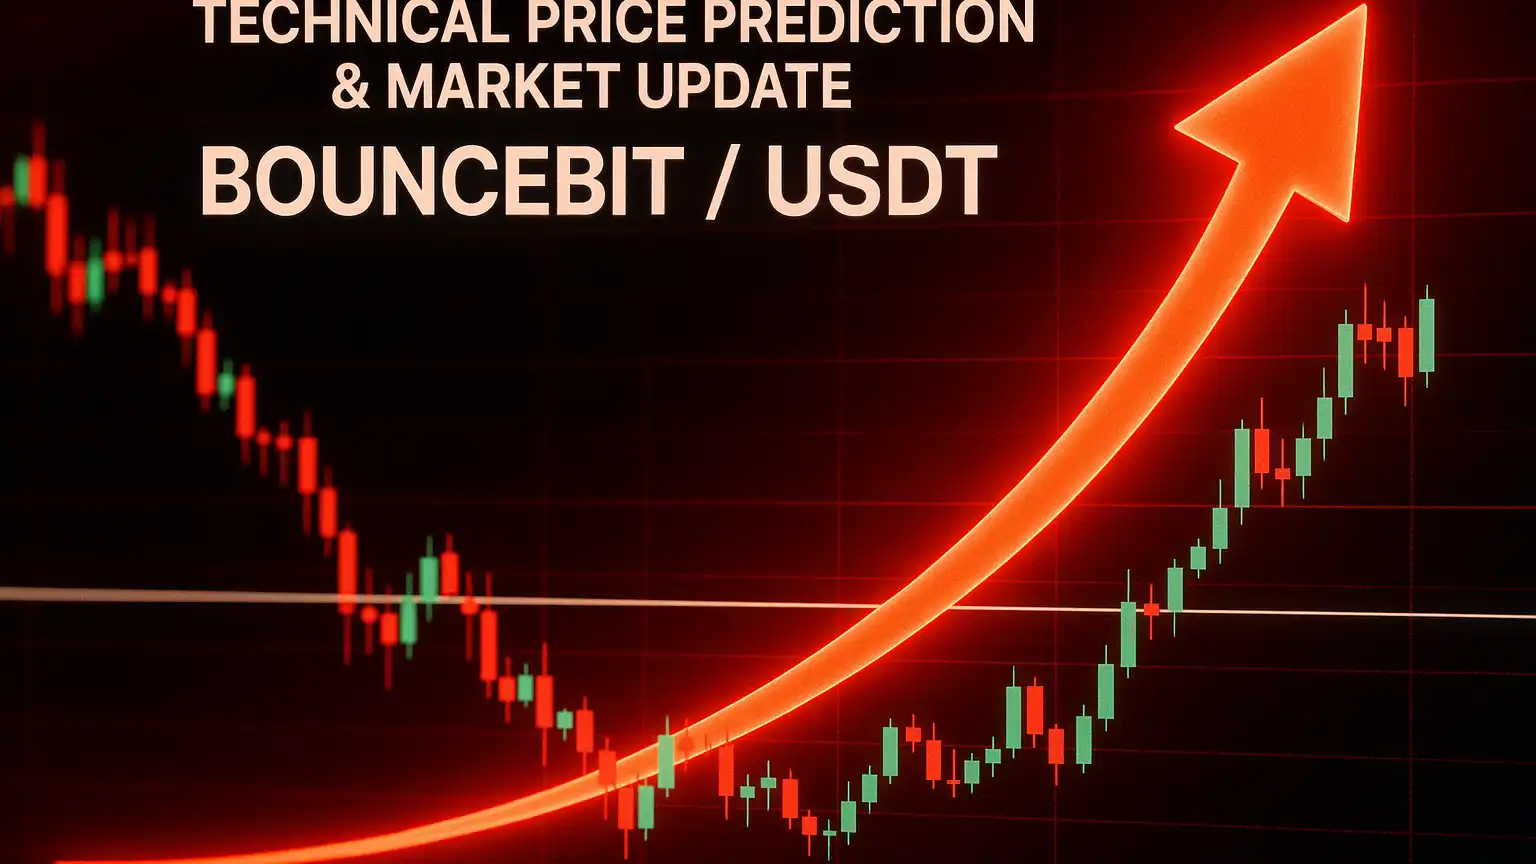
Introduction: Project Momentum and Recent Catalysts
BounceBit (BB) has been gaining some serious traction lately, thanks to two big developments: its growing institutional Real-World Assets (RWA) strategy and the overall momentum we’ve been seeing in the Bitcoin ecosystem. Back in late November 2025, the BounceBit team presented their asset-driven infrastructure at Binance Blockchain Week in Dubai, which really helped solidify their RWA integration plans and put them on the radar of both institutional players and everyday retail investors. Around the same time, Bitcoin’s rally past the $91,000 mark gave a nice boost to many Bitcoin-restaking and CeDeFi projects, including BB. The token jumped about 10% in a single day and climbed nearly 27% over the week. These price movements really highlight how closely BB tracks BTC’s performance and how exposed it is to broader trends in digital asset yield products. This all happened around November 28-29, 2025.
BounceBit has also been rolling out some interesting product updates. Their V3 upgrade brought in rebasing BB-token variants like BBTC, BBETH, and BBUSD that automatically include yield while still being useful for trading, swaps, and providing liquidity. On top of that, their structured yield platform called BB Prime has been making moves by using tokenized money market funds—like Franklin Templeton’s “Benji” program—to blend U.S. Treasury yields with crypto arbitrage strategies, giving investors regulated yield options. All these innovations make BB more attractive to institutions looking for that sweet spot between traditional finance and DeFi yields.
Technical Analysis: Current Indicators & Key Levels
Right now, BB/USDT is trading at around $0.0896 USDT, up roughly 6.9% in the last 24 hours. Looking at the 4-hour chart, the Relative Strength Index (RSI) is sitting close to 66.7, which shows bullish momentum but also hints that we’re getting near overbought levels. The 4-hour Moving Average Convergence Divergence (MACD) is showing a positive crossover—the MACD line is above the signal line, and the histogram just turned positive at about +0.00068. This tells us there’s building short-term upward pressure. With support from the 4-hour simple moving average hovering around $0.08363 and the exponential moving average at about $0.08353, recent price action suggests we’ve been rallying from these support zones.
Daily pivot points paint a clearer picture of where we might be heading. Key resistance levels to watch are approximately $0.0930 (R1), $0.0967 (R2), and $0.1008 (R3). On the flip side, immediate support sits at $0.0852 (S1), $0.0811 (S2), and deeper down at $0.0774 (S3). The daily pivot point is just below the current price at $0.0889. If we see strong volume and continued institutional interest, markets could test resistance in the $0.093–$0.097 range if this momentum keeps up. However, if price breaks below $0.085–$0.083, we could be looking at a retest toward $0.080 or even lower.
Price Prediction: Scenarios & Target Zones
Bullish Scenario
If BB can hold above its 4-hour moving average band around $0.0835-$0.0840 and keeps that positive MACD momentum going, we could see a push toward the first resistance zone at roughly $0.093. Breaking above R2 at $0.0967 might open up a path to $0.100–$0.101. For that to happen though, we’d need strong trading volumes and some help from external factors—like more institutional money flowing into RWAs or Bitcoin holding steady above its key support levels—to punch through that psychological $0.10 barrier. Long-term holders and momentum traders should keep an eye on the RSI potentially entering overbought territory (above 70) and any MACD divergence, as these could be early warning signs that the rally is running out of steam.
Bearish Scenario
If the upward momentum starts to fade—especially if price can’t hold above $0.0852 (S1) and drops below the 4-hour moving averages—BB might revisit the support cluster between $0.081–$0.083. If that support zone doesn’t hold up, we could see a slide toward $0.0775 (S3). Things like bearish macro sentiment, regulatory concerns around tokenized assets, or weak volume during rallies would definitely increase the downside risk. Traders should watch for the MACD weakening (with the signal line crossing back above the MACD line) and the RSI dipping below 50 as potential red flags.
Visual Reference

Outlook: What Traders Should Watch
In the near term, here’s what you should keep your eyes on: first, how price behaves around that $0.093 resistance zone; second, the strength of volume during upward moves—weak volume might signal we’re running out of gas; third, how the MACD histogram develops on both 4-hour and daily timeframes; fourth, any new token unlock schedules, supply dilution, or regulatory news that might affect institutional participation; and fifth, Bitcoin’s performance—if BTC takes a sharp turn downward, BB will likely feel the pain since it tends to be more volatile. Looking at the bigger picture, BounceBit’s long-term potential really comes down to its unique positioning that combines Bitcoin restaking, rebasing yield tokens, and RWA integrations. Under the right conditions, BB could reach and even push past $0.10, but if things get rocky, the near-term downside target is around $0.08 or lower.
*Data is drawn from technical indicators as of current chart snapshot and market conditions; this is not financial advice.