Recent Developments & Fundamental Context
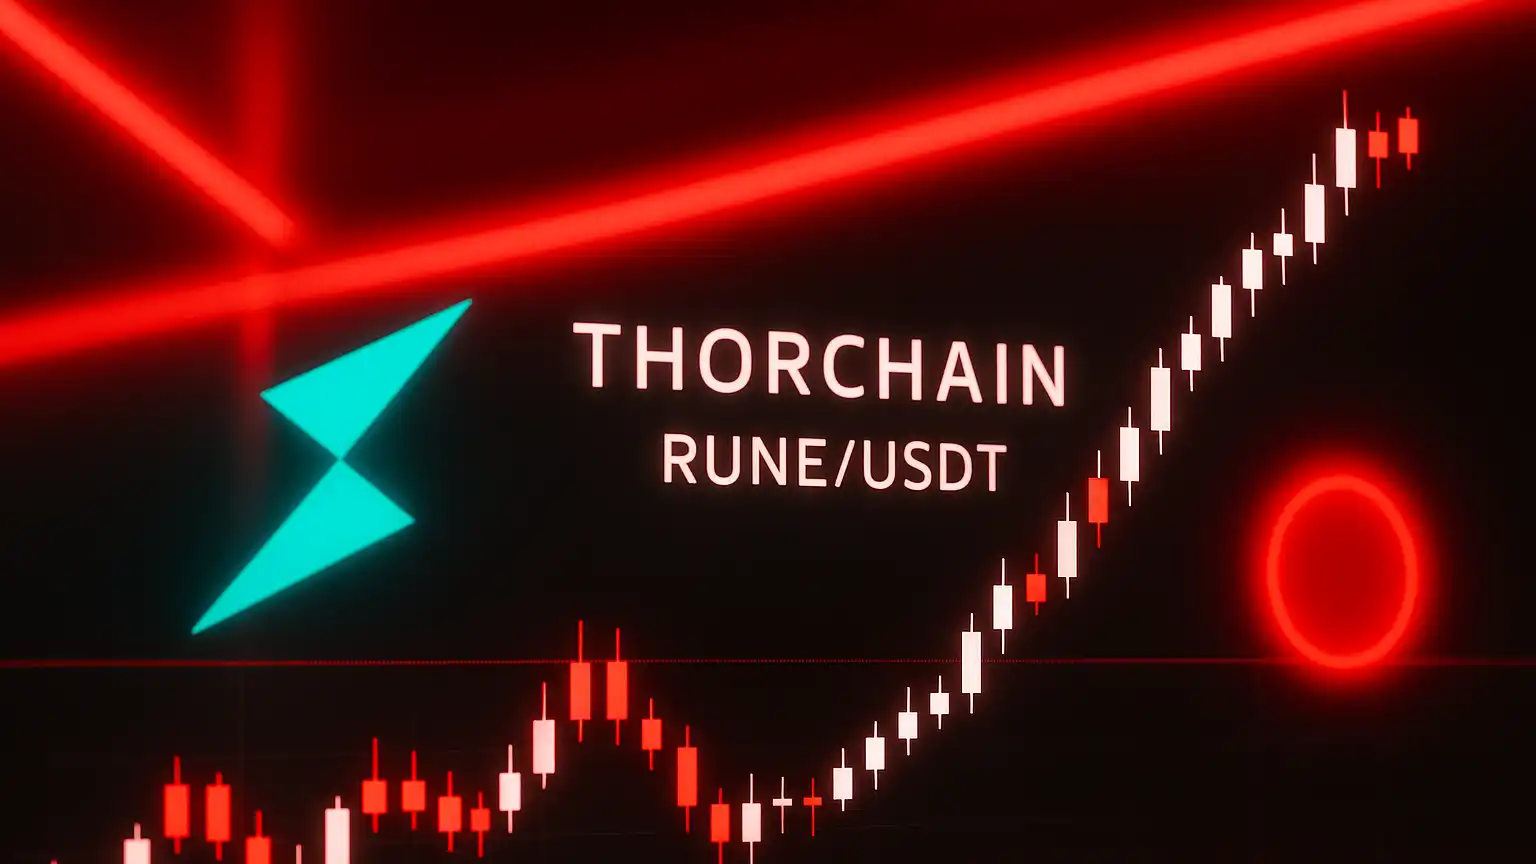
THORChain has been making some impressive strides lately with several upgrades that are catching the eye of DeFi enthusiasts and cross-chain traders. The biggest news is probably the Solana integration going live in early 2026—this opens up THORChain to a massive, active community. They also rolled out a public beta for their native swap interface toward the end of 2025, with the full version expected to launch sometime in Q1 2026. This is pretty exciting because it means users will eventually be able to swap across different chains without messing around with bridges or external wallets, which should make everything smoother and more user-friendly. There’s also talk of cutting block times from around 6 seconds down to just 1–2 seconds, which could really speed up swap finality once it’s done. Even with the price taking a beating—down about 51% in Q4 2025—the underlying numbers actually look surprisingly healthy. TVL measured in RUNE climbed roughly 22.6% quarter-over-quarter, protocol fees jumped about 39%, and daily unique swappers increased around 24%. Sure, the average trade size went down, but the growing activity suggests people are actually using the network more, despite the market turbulence.
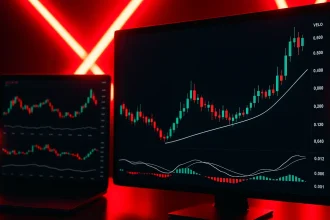
Technical Indicators & Price Structure
Right now, RUNE/USDT is trading around $0.4243, which is up about 1.07% in the last day. Looking at the 4-hour chart, the RSI is sitting at roughly 58.5—that’s showing some bullish energy without being overbought, so there’s still room to move. The MACD is looking pretty decent too, with the MACD line sitting above the signal line and a histogram reading around +0.00162, pointing to some recent upward pressure. The 4-hour simple moving average is near $0.4156 and the exponential moving average is around $0.4194—both just under the current price, which could act as support if things pull back a bit. For daily pivot points, resistance shows up at R1 around $0.429, R2 near $0.433, and R3 at $0.438, while the pivot itself is at $0.424. On the support side, we’ve got S1 at $0.420, S2 at $0.415, and S3 down at $0.411. When you zoom out to bigger timeframes though, things get a bit murkier. Some recent analysis suggests that about 76% of indicators are leaning bearish versus only 24% bullish. That means any upward momentum might struggle to hold unless we see some strong catalysts or convincing volume coming in.
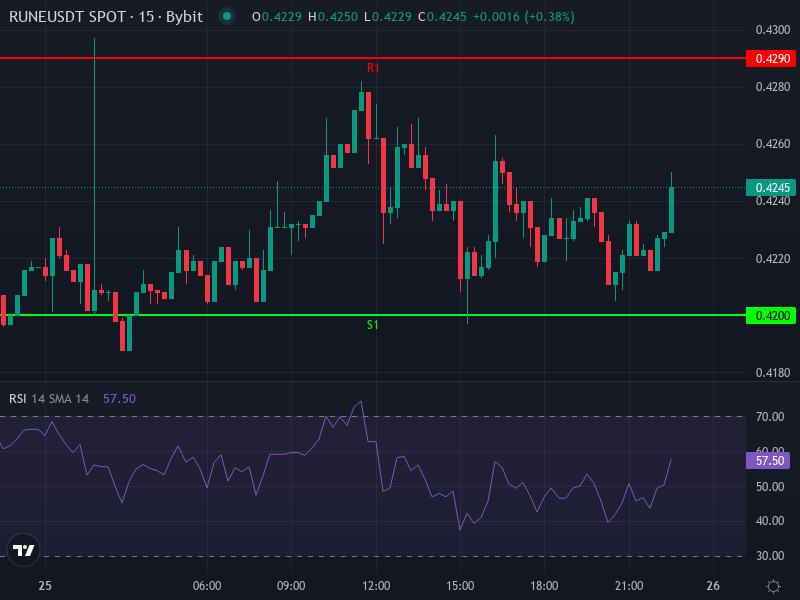
Key Support & Resistance Zones
The $0.415–$0.420 zone is really important to watch on the support side. It lines up nicely with both the S1 and S2 pivot levels and those 4-hour moving averages we mentioned. If the price breaks below this area, we could easily see it sliding down toward $0.407 or so. On the flip side, the immediate resistance is hanging out around $0.429–$0.433, matching up with R1 and R2, with a tougher barrier closer to $0.438 at R3. How the price acts around these levels will probably tell us a lot about where things are headed next. It’s worth noting that the longer-term moving averages—like the 50-day and 200-day—are still sitting above current prices, which creates overhead resistance unless there’s a strong breakout to flip them.
Price Prediction Scenarios
Putting together the technicals, fundamentals, and general market vibes, here are a couple of scenarios that could play out:
- Base case (Next 1–2 weeks): We’re probably looking at some sideways action between $0.420 and $0.435. If buyers show up around that $0.420 support, we might see a push toward $0.433–$0.438. But if that doesn’t hold, there’s a real chance we could drop down to the $0.407–$0.410 support zone.
- Medium term (1–3 months): If the development side keeps delivering—more adoption from the Solana integration, the block time improvements, and those native swaps gaining traction—RUNE could make a decent recovery toward $0.500. On the other hand, if the broader market stays rough or the new features don’t gain much traction, we could see prices drift down toward the $0.30–$0.35 range.
Oscillator Readings & Momentum Outlook
With RSI on the 4-hour hanging around 58, there’s definitely some headroom before things get overbought. The MACD histogram expanding into positive territory backs up the short-term bullish lean. But here’s the thing—when you look at the bigger picture on daily and weekly charts, those longer timeframe indicators are still looking bearish. That means any rallies could run into sellers pretty quickly. Volume is going to be absolutely key here. Without solid buying volume backing up any upward moves, those attempts are pretty fragile and could reverse fast. Watch out for any big macro surprises—inflation data, regulatory announcements, stuff like that—or weakness when price tests those short-term resistance levels. Those would be your warning signs that things might be turning south.