
Project & News Context: PNUT’s Origin and Sentiment Drivers
Peanut the Squirrel, trading under the ticker PNUT, is a meme-token that launched on the Solana blockchain back in November 2024. The project was born out of a tragic and controversial story—the euthanasia of Peanut, a beloved social media squirrel, by New York state authorities. The incident struck a chord with animal lovers and internet communities alike, quickly transforming into a movement around animal rights advocacy and viral storytelling. With a fixed supply of approximately 1 billion tokens that were fairly launched and fully circulated from day one, PNUT has carved out a unique niche combining emotional narrative with the technical advantages of Solana’s low-fee infrastructure.
The story hasn’t faded into the background either. Ongoing legal discussions and regulatory reviews around the original case continue to shape public perception. There’s even talk of “Peanut’s Law”—proposed reforms by New York’s Department of Environmental Conservation that would require hearings before any wildlife seizures or euthanasia decisions. While this keeps the project in the spotlight and energizes its community, it also means PNUT remains vulnerable to sudden shifts in media coverage or regulatory sentiment. It’s a double-edged sword that makes this token particularly sensitive to real-world events.
Current Price Behavior & Technical Indicators
Right now, PNUT is going through a rough patch. The token is trading around USD 0.08247, down sharply by about −9.59% over the past 24 hours. That puts it significantly below both its 4-hour simple moving average of roughly 0.08808 USDT and its 4-hour exponential moving average sitting near 0.08838 USDT. In other words, the bears are firmly in control at the moment.
When we dig into the momentum indicators on the 4-hour timeframe, the picture doesn’t get much prettier:
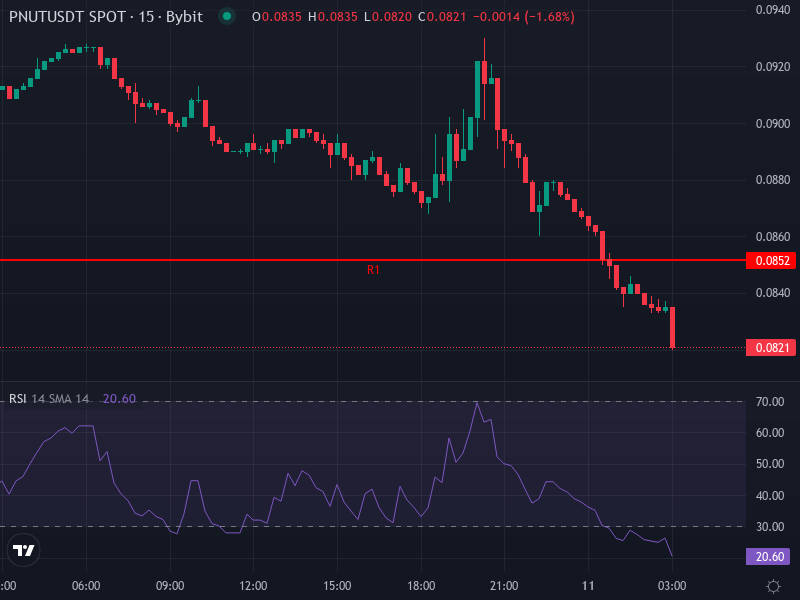
- The Relative Strength Index is hovering around 36.28. That’s weak territory, though not quite at oversold levels yet where bounce opportunities typically emerge.
- The MACD is flashing red flags too, with a negative histogram and the MACD line sitting below its signal line. This confirms that bearish momentum hasn’t exhausted itself.
Zooming out to the daily charts paints an even grimmer picture. PNUT is firmly planted in “Strong Sell” territory across the board. Nearly every major moving average—whether you’re looking at the 5-day, 10-day, or 50-day—is screaming sell signals. All twelve assessed moving average indicators are aligned bearishly. Additional oscillators like Williams %R, CCI, and ADX all confirm the downtrend has real strength behind it. This isn’t just a minor dip; the technicals are showing coordinated bearish pressure.
Support and Resistance Zones & Pivot Points
Understanding where PNUT might find footing or face headwinds is crucial right now. The daily pivot point analysis gives us a roadmap:
Resistance levels: R1 ≈ 0.08517 R2 ≈ 0.08833 R3 ≈ 0.08997
Pivot (short-term equilibrium): ≈ 0.08353
Support levels: S1 ≈ 0.08037 S2 ≈ 0.07873 S3 ≈ 0.07557
With the current price sitting at about 0.08247—just below the pivot point—the first meaningful resistance isn’t far above at R1 around 0.0852. Any attempt at a bullish bounce will need to contend with that level first. On the flip side, support at S1 near 0.0804 represents the first line of defense for bulls. If that breaks, things could get uncomfortable quickly, with S2 at roughly 0.0787 and S3 down at 0.0756 waiting below. Each broken support level increases the likelihood of accelerated selling as stop-losses get triggered.
Price Prediction Scenarios: Key Levels & Potential Trajectories
Looking ahead, there are a few distinct paths PNUT could take depending on how the market digests current conditions and whether any external catalysts emerge:
- Bullish Reversal Scenario: For the bulls to regain control, PNUT would first need to reclaim the pivot level around 0.0835 and then convincingly break through R1 at approximately 0.0852. If that happens, we could see momentum shift as shorts cover and new buyers enter, potentially driving price toward R2 near 0.0883. Of course, this reversal would need confirmation from the momentum indicators—think MACD crossing back above its signal line or RSI climbing back above 50. If all these pieces fall into place, intermediate targets in the 0.090 to 0.095 range become realistic within a reasonable timeframe.
- Neutral‐to‐Bearish Drift: More likely in the near term is a scenario where PNUT continues to struggle below the pivot point. If R1 continues to act as a ceiling, we might see the price drift down toward S1 at 0.0804. This support could hold and create a choppy range-bound environment between S1 and R1 as traders wait for clearer directional signals. However, if S1 fails to hold under pressure, the next stops would be S2 around 0.0787 and potentially S3 at 0.0756. This kind of grinding lower action tends to shake out weaker hands.
- Strong Bearish Breakdown: In the worst-case scenario, if the key support levels at S1 and S2 crack—especially on heavy volume—we could see panic selling kick in. The downward momentum would likely accelerate, potentially driving price toward S3 or even lower as cascading stop-losses and negative sentiment feed on themselves. This becomes more probable if the broader crypto market turns sour or if unexpected negative news hits the project.
Here’s the thing traders need to remember about PNUT: this token can turn on a dime. As a meme coin built on emotional resonance and community sentiment, it’s prone to wild swings that don’t always respect technical levels. A single viral tweet, unexpected legal development, or shift in the regulatory landscape around the Peanut story could trigger a sharp reversal—or an equally sharp decline. The technical analysis gives us a framework, but with PNUT, external narrative events might matter just as much, if not more. Anyone trading this asset needs to keep one eye on the charts and the other on social media and news feeds.