
Recent Context & Price Drivers
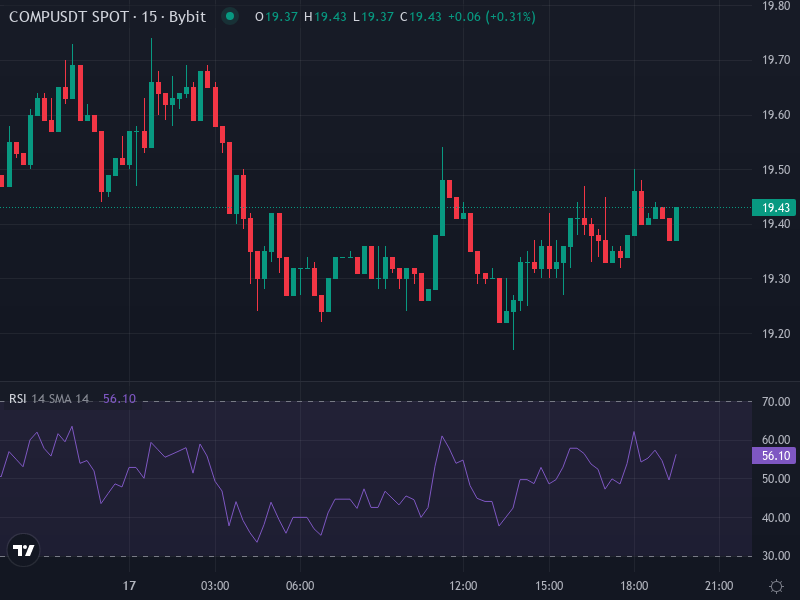
Looking at the latest market data, COMP is currently trading around $19.42, down about 0.61 USD over the past 24 hours. When we check the 4-hour chart, the Relative Strength Index (RSI) sits at approximately 64.16, which shows some underlying strength without pushing into overbought territory.
The MACD indicator on the 4-hour timeframe is telling an interesting story. The MACD line is running around 0.3306, sitting just beneath its signal line at roughly 0.3424. The histogram is showing small negative values, which suggests the short-term momentum might be losing steam.
Daily pivot analysis gives us some clear trading levels to watch. The main pivot point sits around $19.53. Above that, we’re looking at resistance targets of approximately $19.90 for the first level, $20.36 for the second, and $20.73 for the third. On the downside, support zones are positioned near $19.07, $18.70, and $18.24. These levels create a pretty well-defined range for near-term price action.
On the news front, sentiment has been somewhat muted lately. That said, founder Robert Leshner’s work on an on-chain IPO initiative caught some attention recently, though it hasn’t really translated into any major fundamental shifts for the token yet.
Indicator-Driven Technical Analysis & Projection
On the 4-hour chart, COMP is holding above both its Simple Moving Average and Exponential Moving Average, which are clustered around $18.86. This area is acting as immediate support right now. If the price slips below these moving averages, we could see it drift down toward those daily support levels around $18.70 or even $18.24.
The daily timeframe is painting a more mixed picture. The 14-day RSI is hovering near 48.5, which is pretty neutral territory. Moving averages are sending conflicting signals—the shorter 5-day averages are close to current prices, but the longer-term averages from 20 days out to 200 days are sitting higher up, creating overhead resistance.
The daily MACD shows a weak positive crossover, but there’s no strong bullish confirmation yet. The struggle to break convincingly above the $20 level suggests that upside potential might be capped unless we see a surge in trading volume or broader strength across the DeFi sector.
Near-Term Scenarios (Next 1-2 Weeks)
If buyers can defend support above $18.86 and manage to push through resistance in the $19.90–20.00 zone, there’s a realistic path toward the second resistance around $20.36, or even the third near $20.70. We might even see a test of $21 if the overall crypto market sentiment turns more positive. Keep in mind that volume will be critical for any sustained breakout above these resistance levels.
On the flip side, if we see a breakdown below the $18.86 support level, especially if the MACD histogram continues declining and RSI drops below 50, the door opens to testing the $18.70 support level, followed by $18.24. A sustained break below that range could expose the mid-$17 area.
Strategic Implications for Traders & Investors
For active traders, COMP is presenting a fairly tight risk-reward setup right now. Potential entry points near the $18.80 support level with stop-losses placed just below $18.50 could target the pivot area or first resistance zone around $20.00. Watch for volume spikes and a daily close above $20.00, as that would significantly improve the odds of continued upward movement.
Long-term investors might see value in Compound’s position within the DeFi ecosystem, along with the founder’s ongoing initiatives and sector developments. However, it makes sense to stay cautious until those intermediate resistance zones are clearly broken, especially since those longer-term moving averages are still acting as overhead pressure. A confirmed break above $20.70 would likely be needed to shift the overall trend toward more convincingly bullish territory.