Recent Context: Market Sentiment and Structural Shifts
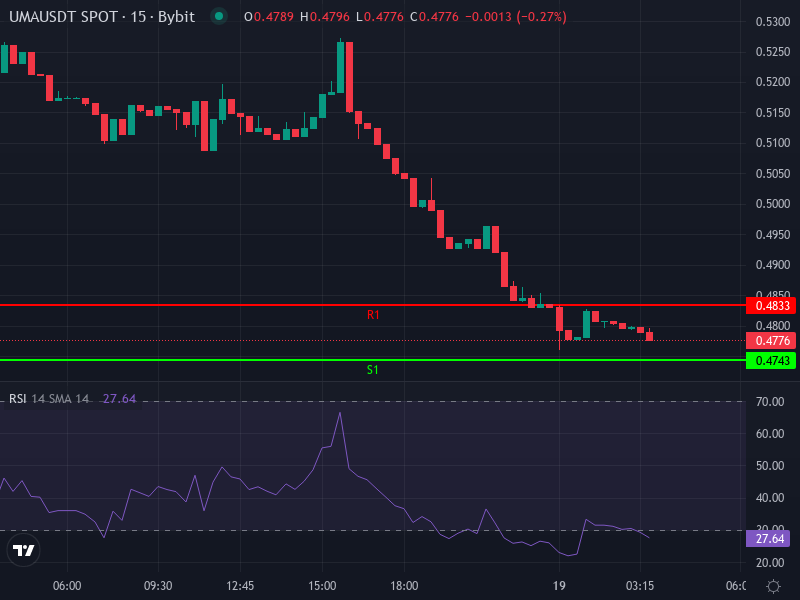
UMA has been taking a beating lately, with the price sitting around $0.47835 right now—that’s a daily drop of about –8.91%. This selloff is happening alongside broader weakness in the DeFi space, where traders are pulling back from riskier tokens. Some of the negative vibes come from concerns about governance participation and how much of the token supply is concentrated in just a few hands. Yes, there have been some solid developments on the protocol side—like upgrades to UMA’s optimistic oracle and synthetic assets framework—but these haven’t been enough to turn the tide in the near term.
Technical Indicators: Key Levels and Signals
If we look at the 4-hour chart, UMA’s Relative Strength Index (RSI) is sitting at around 36.76. It’s getting close to oversold levels but isn’t quite there yet—which means we’re still in bearish territory, though a bounce could be on the cards if support manages to hold. The 4-hour MACD isn’t looking great either: the MACD line is at –0.00616, sitting below the signal line at 0.00158, and the histogram shows –0.00774, all pointing to continued downward pressure for now.
When it comes to moving averages on that same 4-hour timeframe, the current price of around $0.478 is trading below both the Simple Moving Average at roughly $0.522 and the Exponential Moving Average at about $0.516. These averages have now flipped to resistance. If UMA can push through them with some real conviction, we might see a short-term turnaround. If it can’t, expect more downside.
Looking at daily pivot points gives us some key levels to watch: the daily pivot sits around $0.47966, with support coming in at roughly $0.47433 (S1), $0.47067 (S2), and $0.46533 (S3). On the upside, resistance is at about $0.48333 (R1), $0.48867 (R2), and $0.49233 (R3). The way things are moving now, that pivot level might act as a ceiling unless we see some real buying volume come in.
Short-Term Scenarios: Next Few Days to Weeks
If the bears stay in control, UMA could slide down to the S2 pivot at around $0.47067, and if that doesn’t hold, we might see it test S3 near $0.46533. These would be important areas to watch for buyers to potentially step in. On the other hand, if we get a bounce above the daily pivot and break through resistance at R1 (around $0.48333), that could open the door to R2 at roughly $0.48867, with the more optimistic target being R3 near $0.49233—especially if volume picks up.
Longer-Term Forecast: End-of-Quarter and Beyond
Based on recent price prediction models, the outlook for UMA over the next few months leans bearish. In the near term—say, the next month—there’s a possibility of climbing back toward the $0.55 to $0.57 range, but that would require conditions to improve significantly. Looking at the 3- to 6-month horizon, many forecasts point to further downside, with prices potentially dropping to the $0.45-$0.40 zone if we don’t get any strong positive catalysts. Things could obviously change if resistance levels get reclaimed or if the network sees increased usage, but right now the trend favors more downside.
Key Drivers to Monitor
A few fundamental factors could shake up the technical picture: greater adoption of UMA’s oracle and synthetic asset tools; a broader recovery in DeFi markets; improvements in governance that address token concentration issues. On the flip side, things like macro headwinds, stagnant or declining total value locked in DeFi, or increased competition from other oracle networks could keep the pressure on.