Recent Developments & Market Context
RateX (RTX) is a Solana-based protocol that’s been making waves in the leveraged yield trading and structured finance space. The project picked up some serious momentum back in November 2025 when they closed a $10.4 million funding round. That capital is going toward scaling their protocol, particularly to roll out something they’re calling “Leverage Tokenization” through their V2 upgrade—Mooncake. They’re also pushing into USD-denominated yield tokens and liquidation-free leverage markets, which is pretty ambitious. The backing from big names like Animoca Ventures, GSR, and Crypto.com Capital tells you there’s real institutional interest here.
Now, the tokenomics are worth paying attention to because they’re going to impact price action in the near term. There’s a hard cap of 100 million RTX tokens, but right now only about 16.66 million are actually circulating—that’s a pretty tight supply. Ecosystem and community allocations account for roughly 44% of the total supply, and they airdropped about 6.66% of that in Q4 2025. Here’s where it gets interesting: the unlock schedules for team, treasury, and investor tokens are rolling out gradually through Q1 and beyond. That means we’re looking at some potentially significant selling pressure as those vested holders get access to their tokens and decide what to do with them.
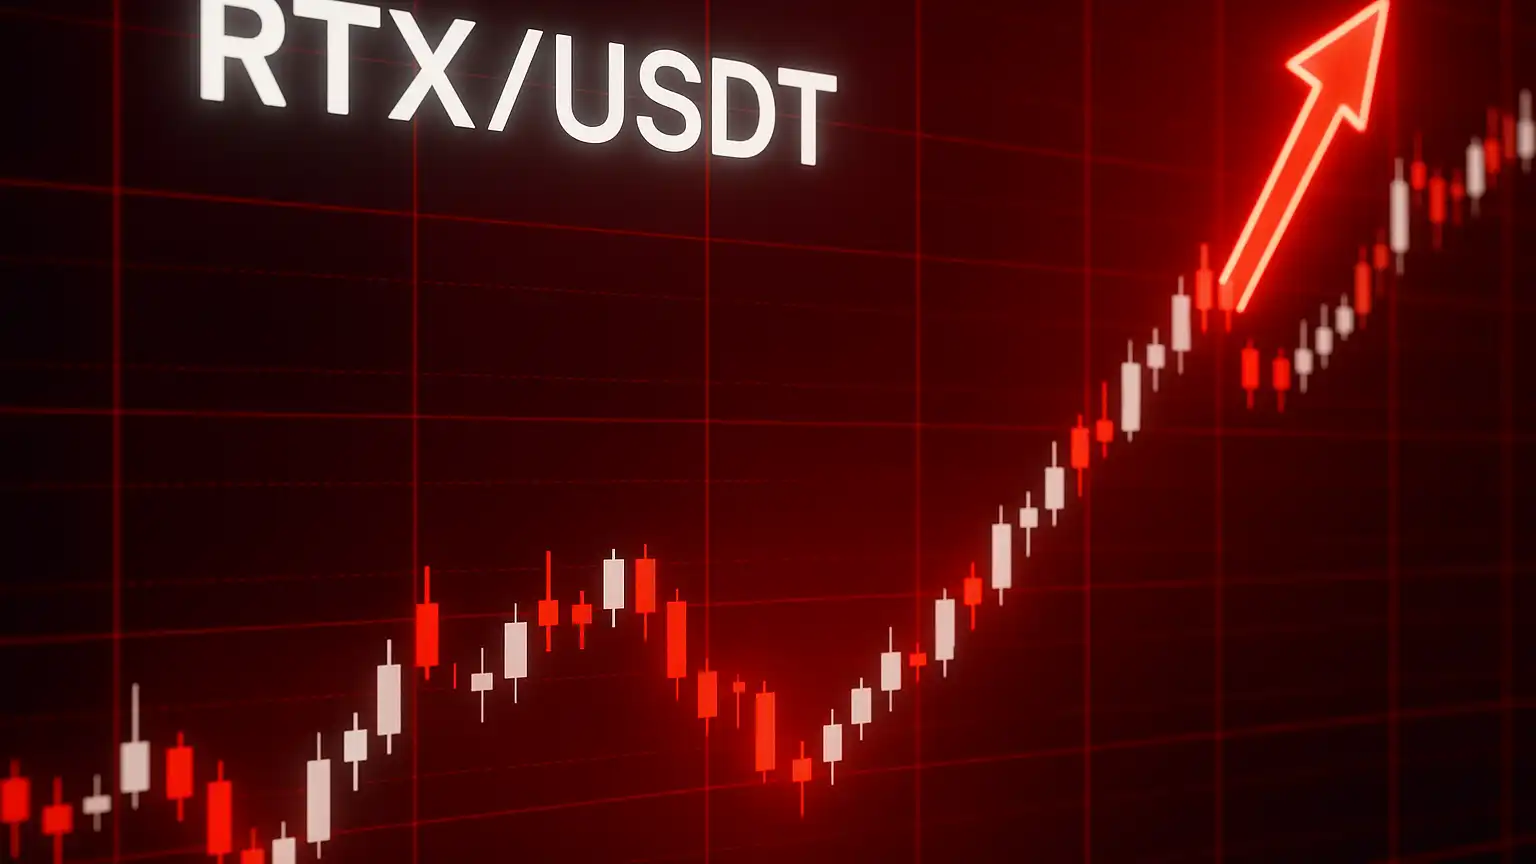
Current Price Action & Technical Indicators
RTX is sitting at $2.49 right now, down about 1.07% over the last 24 hours. Nothing dramatic, but it’s part of a bigger picture. The token had a nice pop—around 37.5%—right after its Binance Alpha listing and the associated airdrops in mid-December. That was the high-water mark. Since peaking around December 22nd near $4.40 (its all-time high), we’ve seen a pretty substantial pullback. The price is now trading below some key short-term moving averages like the 7-day and likely the 14-day as well, which tells us momentum has definitely weakened and the trend is leaning bearish at the moment.
Looking at the indicators:
- The 7-day RSI is hovering around 38-40, which is getting into oversold territory. But here’s the thing—unless it bounces back above 50, we’re not out of the woods yet and there’s still downside risk on the table.
- Volume has cooled off compared to those initial listing days, which isn’t a great sign. Lower trading interest usually means the market is struggling to sustain higher prices.
Support & Resistance Zones
From what we’re seeing on the charts, there’s likely support around $2.30. If that breaks, we could be looking at a slide back toward the launch area around $1.60, or potentially even lower to test that airdrop low near $1.20. On the flip side, resistance is clustering between $2.60 and $2.80—these were short-term peaks during recent bounce attempts. If RTX can push through $2.80 with solid volume backing it up, that could shift the short-term outlook to bullish.
Scenario Forecasts: Near & Mid-Term Predictions
Thinking about the next 4-12 weeks, there are a few ways this could play out depending on market sentiment, those unlock events, and how the technicals develop:
- Base Case: RTX probably consolidates somewhere between $2.30 and $2.80. If volume stays weak or we see broader risk-off conditions in crypto, the price will likely drift toward that lower bound around $2.30. A solid test of support followed by a bounce could see us retesting $2.80 to $3.00. Honestly, staying range-bound until those Q1 unlocks pass seems like the most probable outcome.
- Bullish Case: If Mooncake features start getting real traction, if DeFi sentiment improves across the board, and if those unlocks get absorbed without too much panic selling, we could see a breakout above $3.20 heading toward $3.50. Looking at previous rallies, there’s even potential to push back toward $4.00 or higher—but that’s only happening if we see volume spike and buyers step in aggressively.
- Bearish Case: On the downside, if those early investor or team token unlocks hit during a rough patch for DeFi overall, RTX could fall through $2.30 and potentially head down to $1.60 or lower. Weak sentiment, a broader altcoin selloff, or if the protocol’s actual usage doesn’t pick up—any of those could accelerate the decline.
Key Catalysts & Risk Factors to Track
- Upcoming Unlock Schedules: Those big allocations vesting in Q1 2026—team, treasury, investor portions—are the elephant in the room. They could flood the market with supply. Keep an eye on on-chain data, especially large wallets moving tokens to exchanges. That’ll give you advance warning of potential selling pressure.
- Protocol Adoption & Mooncake Metrics: The real test is whether people actually use this thing. How many leveraged products are being utilized? What’s the TVL in yield token markets looking like? Are the leverage tokens getting traction? Growth in stable or USD-denominated yield products will matter a lot for establishing real utility beyond speculation.
- Volume & Market Sentiment: Broader DeFi trends are going to influence RTX heavily. Things like the Fear & Greed Index and the Altcoin Season Index give you a read on overall risk appetite. When crypto volume is low across the board, altcoins like RTX typically struggle.
- Macro Risks: Don’t ignore the bigger picture. Regulatory crackdowns, interest rate changes, or a collapse in stablecoin yields could hit leverage-focused protocols hard, especially ones offering fixed yield or synthetic yield exposure like RateX.