
Recent Developments & Market Sentiment
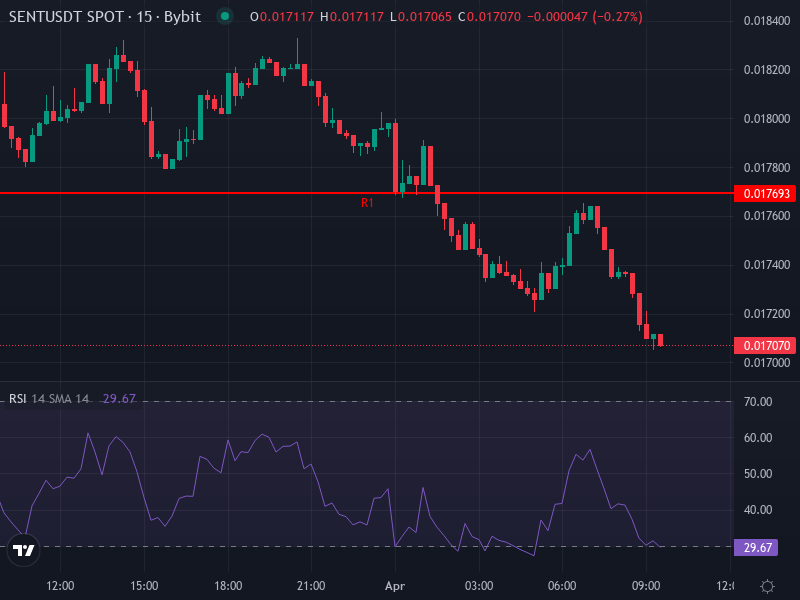
Sentient token (SENT/USDT) is currently hovering around $0.01709, down roughly 4.63% over the last 24 hours. What’s drawing attention to Sentient is its role in the open-source AGI space, particularly its “GRID” network that connects AI models and agents with a strong emphasis on decentralized governance. The vibe from the community seems cautiously optimistic, though trading volumes are pretty thin right now—likely because investors are being extra careful given all the economic uncertainty floating around.
Looking at what people are saying off-chain and in various research corners, Sentient appears to be in its early days. Forum chatter indicates that while the roadmap looks promising—they’ve already got over 100 components running in the GRID network—the real hurdle isn’t so much delivering the technology. It’s more about building up liquidity, getting people to actually use it, and creating those network effects that make projects take off. There haven’t been any big announcements lately that would shake up the fundamentals much.
Technical Indicators & Key Price Levels
When you look at the recent 4-hour charts, there are a few bearish signals showing up. The Relative Strength Index (RSI) is sitting at around 38.7, which shows some weakness without being in extreme oversold territory just yet. The 4-hour MACD doesn’t look great either—the MACD line has dipped below its signal line, creating a negative histogram. This basically means sellers have the upper hand in the short term.
The Simple Moving Average (SMA) for the past 4 hours is at about $0.01763, while the Exponential Moving Average (EMA) is even higher at roughly $0.01805. Both of these are sitting well above where the price is now, which means they’re acting as resistance if buyers try to push things back up.
As for support and resistance, daily pivot points give us some solid reference points to watch. The daily pivot is sitting at approximately $0.01737, with the first support level down around $0.01673 and stronger support further below near $0.01641. If you’re looking up, resistance shows up near $0.01769 (R1), $0.01833 (R2), and $0.01865 (R3). If this downtrend keeps going, breaking below support could mean we’re headed down to test the $0.0158-$0.0164 range.
Price Prediction & Scenarios
Bullish Scenario
If SENT manages to climb back above that 4-hour SMA at $0.01763 and pushes through the EMA at $0.01805, we could see momentum flip toward those resistance levels near $0.01833 and $0.01865. A daily close above these zones with decent volume backing it up might even open the door to hitting $0.0200 in the coming weeks. What would help this bullish case? Strong on-chain activity showing agents actually using the network, new partnerships being announced, or just general strength across AI-focused crypto projects.
Bearish Scenario
On the flip side, if SENT can’t hold that $0.01673 support level, or if the broader market takes a turn for the worse, we’re probably looking at a slide toward $0.01640, potentially going as low as $0.01577. Once it breaks below those levels, downward momentum tends to feed on itself, and we could see it retrace all the way to $0.01450 if market sentiment stays sour. Any extended period where price stays below both the SMA and EMA would pretty much confirm that bears are running the show.
Neutral & Consolidation Path
There’s also a middle-ground possibility where SENT just bounces around between $0.01670 and $0.01770, especially if neither buyers nor sellers can get organized enough to make a real move. In that case, the RSI would probably hang out in the 35-45 range, and the MACD histogram would stay slightly negative. This kind of sideways action makes for choppy trading, and if you’re trying to catch a direction, you really need to think hard about whether the risk is worth the potential reward.
Trading Recommendations & Risk Management
Looking at the current technical picture and how the market’s behaving, it makes sense to tread carefully here. Jumping into long positions right now without seeing confirmation above resistance is probably asking for trouble. If you’re thinking bullish, waiting for a close above the EMA with solid volume behind it would be smarter. On the other hand, if you’re considering shorts or just want to play defense, significant breakdowns below those support zones might give you an opportunity.
When it comes to managing risk, set your stop-loss near $0.01670 if you’re going long, or around $0.01870 if you’re shorting a bounce. For taking profits, those resistance levels make natural targets: aim for the mid-range around $0.01830, the higher zone near $0.01865, or even further up if we get a broader bullish breakout happening.