Introduction: Recent Catalysts and Market Context
The Dusk Network token has been making waves lately, and for good reason. It’s carved out a unique niche by combining privacy features with regulatory compliance—something that’s becoming increasingly important in today’s crypto landscape. The big news everyone’s talking about is their partnership with Chainlink and NPEX, a regulated Dutch stock exchange. This collaboration is set to tokenize somewhere between €200 million and €300 million worth of real-world assets on DuskEVM. It’s a pretty big deal because it shows how traditional finance and compliant DeFi can actually work together.
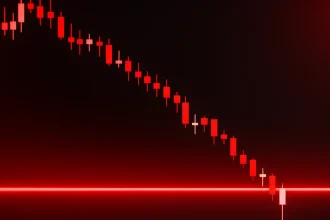
There’s also been an interesting shift in the market, with investors rotating out of established privacy coins like Monero and Dash and into DUSK. This rotation has definitely helped fuel the recent rally. But here’s the thing—after a massive parabolic run that saw gains reportedly exceeding 500% in January 2026, the token hit a wall. Traders started taking profits, and who can blame them? When the daily RSI hits around 91, that’s a pretty clear sign things got overheated. We’ve also seen exchange inflows spike to multiday highs, which usually means people are moving coins to exchanges to sell. So the current price hovering around $0.15–$0.16 feels a bit stretched and vulnerable to a pullback.
Technical Indicator Analysis: Bearish Signals vs Support Landscape
Right now, DUSK is trading at approximately $0.1465, down about 5.7% in the last 24 hours. The immediate resistance sits near the 4-hour simple moving average at $0.1626 and the exponential moving average at $0.1656. Since the price is trading well below both of these, it’s showing a short-term bearish bias—basically, recent average prices are above where we are now, which isn’t great for bulls.
Looking at the 4-hour RSI, we’re sitting around 41.6. That’s below the neutral 50 level, which suggests bullish momentum is pretty weak right now. Without some kind of catalyst, we might see more downside. The MACD isn’t helping the bull case either—the histogram is negative and the MACD line is sitting slightly below its signal line, which just reinforces that bearish lean in the short term.
When we look at the daily pivot points, immediate resistance comes in around $0.1684 and then $0.1887. On the support side, we’ve got immediate support around $0.1364, with the next level down at $0.1247. If we break below that first support level, things could get ugly fast, potentially accelerating down to $0.1247 or even $0.10. On the flip side, bulls would need to reclaim that $0.1684 level to really get things moving upward again.
Outlook Based on Moving Averages and Trend Structure
The longer-term moving averages—the 20, 50, 100, and 200-period SMAs on the daily charts—are all sitting above the current price. That creates multiple layers of overhead resistance. Until bulls can push through and reclaim these levels, we’re probably looking at either consolidation or further downside as the price searches for stronger support.
Price Forecast Scenarios: Potential Trajectories Through Q1 2026
Bearish Base Case: If selling pressure continues, DUSK will likely test that $0.136–$0.140 support zone pretty soon. If that level fails to hold, we could see a move down to $0.1247. This scenario becomes more likely if volume stays weak or if we see more coins flowing onto exchanges. It’s the kind of deeper correction that happens when the market decides it needs to reset after a big run.
Neutral/Stabilization Case: There’s a decent chance price finds its footing above that $0.1364 support and just chills in the $0.14–$0.16 range for a while. In this scenario, the RSI would gradually move back toward neutral territory between 50 and 60, and the MACD histogram would flatten out near zero. The moving averages would act as resistance rather than insurmountable barriers. Basically, we’d be looking at several weeks of sideways action while the market waits for the next catalyst to determine which direction to break.
Bullish Upside Case: Now, if buyers show up strong around $0.15—maybe triggered by new partnership announcements or actual tokenized asset launches—we could see a breakout above that $0.1626–$0.1655 resistance zone. From there, the path opens up to test that $0.1684 level, and if momentum really builds, we could push toward $0.1887. A clean break above that would put $0.20 in play, with the technical target around that R3 pivot. But let’s be real—this would require substantial buying pressure, especially given how overbought things got recently. The fundamentals would need to deliver something meaningful to justify another leg up.
Final Insight: Entry Points and Risk Management
Given where things stand right now, the smart play is probably waiting for confirmation that support is actually holding. If we get a bounce from that $0.1364–$0.140 zone with decent volume and the RSI recovers above 45–50, that would be a more attractive entry point. More aggressive traders might look to catch those pullbacks to that range, but you’d want to be quick with your stops.
Speaking of stops, anything below $0.1247 should probably trigger an exit if you’re long, because below that level, the downside could accelerate quickly. On the fundamental side, there’s real potential here. If those tokenization initiatives on DuskEVM actually launch, or if we get more deals with regulated financial institutions, the upside could be significant. Strong audit results or positive compliance news could also move the needle.
But let’s not ignore the risks—regulatory uncertainty or delays in development could definitely throw cold water on the bullish thesis. Bottom line: technically speaking, DUSK looks moderately bearish in the short term, but if it can stabilize soon, the medium-term picture could be quite attractive. As always, manage your risk accordingly and don’t bet the farm on any single trade.