Recent Developments & Price Context
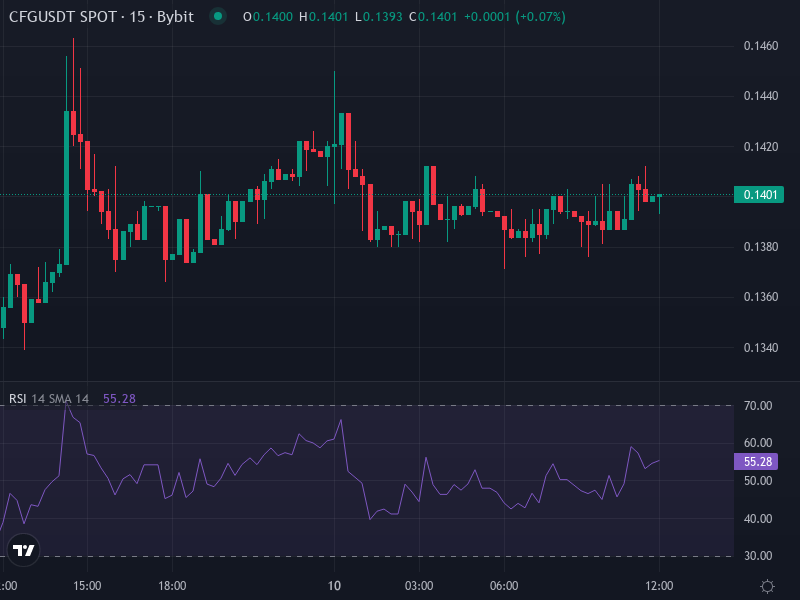
Right now, CFG is trading around $0.1394 USD, up roughly +2.77% over the last day. There’s been quite a bit happening lately that’s moved the needle. The big news was CFG getting listed for spot trading on Upbit, a major Korean exchange. That listing triggered a surge in buying interest and pushed the price close to $0.28 before things cooled off and retraced. On top of that, Centrifuge and Resolv rolled out a pretty significant integration—deploying about $100 million worth of the JAAA CLO fund as leveraged collateral on Aave Horizon. This helped boost Centrifuge’s Total Value Locked considerably. Between the exchange listing hype and the growing buzz around real-world asset tokenization, CFG’s price has been both reactive and news-sensitive.
From a protocol standpoint, Centrifuge has wrapped up its migration to an EVM-native ERC-20 token through Centrifuge V3. This consolidation merged the old CFG and WCFG tokens, making things simpler for DeFi integration and governance. The new tokenomics brought the total supply to around 680 million tokens, with 115 million earmarked for network development and liquidity—though these are subject to governance and vesting timelines. These changes will likely have lasting effects on supply dynamics and how value accrues to the token over time.
Technical Indicators & Support/Resistance Landscape
Oscillators & Momentum
Looking at the key momentum indicators like RSI, MACD, and ADX, things are looking a bit cautious. The daily RSI is hovering in the mid-20s to low-30s across different platforms, which signals oversold or nearly oversold conditions. MACD is mostly negative or neutral—we’ve seen a few short-term crossovers, but none have really led to sustained upward movement. The ADX suggests there’s medium trend strength, though it’s not particularly directional at the moment. Volatility has been elevated: sharp spikes higher when good news hits, followed by pullbacks once the buying frenzy fades.
Moving Averages & Trend Filters
CFG is currently trading well below both its 50-day and 200-day moving averages, whether you’re looking at simple or exponential versions. These moving averages are now acting as overhead resistance. Even the shorter-term moving averages—the 10, 20, and 30-day periods—are trending downward, which tells us that rallies keep running into sellers. To flip the bias toward bullish, CFG needs to break above those moving averages. Until that happens, the overall stance remains bearish to neutral.
Support and Resistance Zones
The most important support level to watch right now is around $0.15 USD. That’s where the price found its footing after the Upbit surge. There’s a secondary support zone near $0.1088 USD, which has held up during previous downside tests. If those levels fail and liquidity dries up, CFG could see further declines toward roughly $0.08, especially if weaker holders decide to exit. On the upside, immediate resistance sits around $0.18 to $0.20. Beyond that, there’s more significant structural resistance near $0.29—the level hit during the Upbit rally and corresponding to the upper boundary of the descending wedge that CFG previously broke out from. A solid move above $0.29 could open the door toward $0.50 down the line, though that would need strong momentum and clear bullish confirmation to materialize.
Forecast Scenarios: What Could Unfold
Scenario A: Bullish Breakout & Reversal
If CFG manages to hold above the $0.15 level and gets a volume spike on an impulse move, we could see it test resistance in the $0.20 to $0.25 range within the next week or two. A crossover where the short-term moving average (like the 20-day EMA) climbs above the longer ones, combined with MACD flipping positive, would really strengthen this bullish case. If momentum continues beyond $0.29, we might even see a push toward $0.40 to $0.50, especially if the real-world asset sector keeps gaining traction and integration news keeps flowing. That said, any gains are likely to be volatile with sharp corrections mixed in.
Scenario B: Continued Range & Pullback Risk
On the flip side, if CFG can’t hold $0.15 or fails to break above $0.20, we could see it drift back toward support around $0.11. In a more severe downturn, there’s potential for testing the $0.08 level. Key risks include fading interest after the listing hype dies down, selling pressure from newly unlocked supply, or broader crypto market weakness. While oversold oscillators might trigger short-term bounces, those could remain shallow if the moving averages keep rejecting higher prices.
Mid-Term Outlook & Catalysts to Watch
Looking out over the next one to three months, CFG’s trajectory will depend heavily on what happens next with catalysts. Things like token utility upgrades, new real-world asset product launches, and institutional adoption will be key. On-chain metrics—particularly TVL growth and actual usage of Centrifuge’s whitelabel tokenization services—will matter more than price action alone. It’s also worth keeping an eye on supply vesting schedules from the CFG Foundation and liquidity levels on major exchanges, as these will influence downside risk. If the project introduces any profit-sharing mechanisms or token burns, that could significantly shift the valuation picture upward.