
Recent News & Market Context
NVIDIA’s tokenized stock version, known as NVDAX or NVDAx, has been catching more eyes lately in the blockchain and tokenization space. Think of it as a digital twin of NVIDIA’s actual stock that you can trade around the clock through crypto platforms. It’s backed 1:1 by real NVDA shares sitting in regulated custody accounts. What makes it appealing is the flexibility – you can buy fractions of shares and trade whenever you want, not just during market hours.
Looking at the numbers, there are roughly 214,950 tokens floating around out there. The market cap sits at about $39.65 million, with daily trading volume hitting around $21.6 million. Recently, prices have been bouncing between $182.58 on the low end and $190.15 on the high end. The token hit its peak around $211.55 back in late October 2025.
When you zoom out and look at the regular NVIDIA stock, things get interesting. The technical picture is kind of mixed right now. Price is sitting below those shorter-term moving averages – the 20-day and 50-day ones – which tells us there’s some near-term bearish pressure or at least consolidation happening. But the longer-term averages like the 100-day and 200-day are still looking supportive. Indicators like MACD and RSI on the main stock are pretty neutral to slightly negative in the short run, suggesting we’re not seeing major downside risk but also not much pushing things up without some new catalyst.
Technical Indicator Breakdown for NVDAX-USDT
Diving into NVDAX specifically, the overall trend looks bullish even though we’re seeing some short-term resistance popping up. Most moving averages – from the 10-day all the way out to 200-day – are flashing “Buy” signals, especially those 20, 50, 100, and 200-day simple and exponential ones. The 5-day moving average might be running a bit ahead of current price, which could mean things got a little stretched in the very short term.
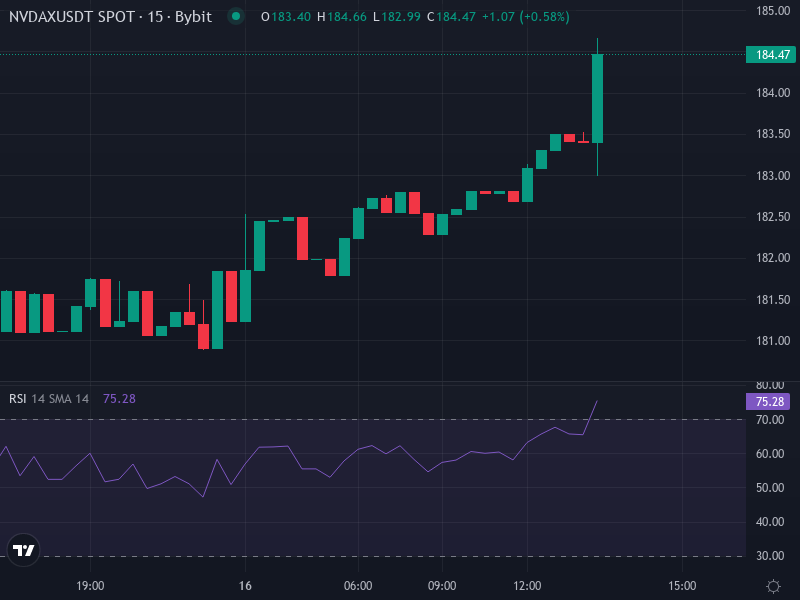
The 14-day RSI is hanging around the mid-60s, about 65 or so. That’s bullish territory but getting close to that overbought line at 70. Stochastic and StochRSI are also pointing upward, telling us momentum is still there but we might be bumping into some resistance soon. MACD is showing positive, with a bullish crossover situation happening. The ADX is pretty elevated, which means the trend is strong but could also be getting tired. Other indicators like Williams %R, CCI, and ROC add some color – ROC confirms we’ve had recent upward acceleration, CCI is staying neutral so not overbought yet, and Williams %R shows we’re getting close to extreme territory but not quite there.
One thing to keep in mind is volatility. The ATR is suggesting we’re seeing bigger price swings than usual, so be ready for sharp moves either way. Looking at pivot points, resistance is hanging out around $190-$192, with support down near $182-$180, which lines up with what we’ve been seeing in recent trading.
Price Prediction Scenarios for NVDAX
Based on what the technicals are telling us, here’s how things might play out over the next few weeks:
- Bullish Base Case: If NVDAX pushes through that $190–$192 resistance zone and we keep seeing strong volume with positive MACD momentum, we’re probably looking at $200 as the next stop. After that, resistance could kick in around $210, which is where we hit those previous highs.
- Sideways / Consolidation: If that resistance holds and momentum starts cooling off, we might just see price bouncing around between $180 and $190 for a while. That would actually be healthy – gives those indicators like RSI and MACD time to reset and potentially set up a clearer move later on.
- Bearish Case: If we break below that $180 support level, things could get dicey. We’d be looking at potential moves down to $175 or even $170, especially if the broader markets start looking weak or NVIDIA stock itself underperforms. Watch for volume spikes on the downside – that’s when moves can happen fast.
Key Support & Resistance to Monitor
Support Zones:
• $180: psychological level and recent floor.
• $175: backup support if $180 doesn’t hold.
Resistance Zones:
• $190–192: where we’re running into trouble right now.
• $200–210: longer-term targets if bulls take control again.
Risk Management Tips: Keep an eye on volume changes – they’ll give you clues about whether we’re breaking out or breaking down. Consider setting stop-losses around $175 if you’re worried about the bearish scenario. In the bullish case, maybe scale into positions rather than going all-in to manage your exposure. If RSI pushes above 70 and the MACD histogram starts weakening, those are your early warning signs that a pullback might be coming.