![Technical Analysis & Forecast: BitTorrent [New] (BTT/USDT)](https://trakinvest.ai/wp-content/uploads/2026/02/file-52.webp)
Market Context & Recent Developments
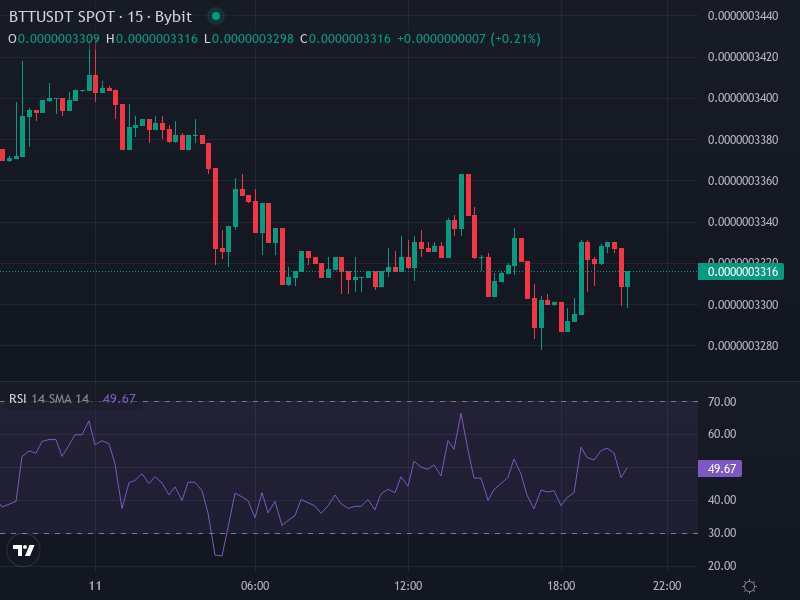
BitTorrent [New] (BTT) is trading at roughly 0.0000003311685284544213 USDT right now, down about −1.71% over the last 24 hours. The project has been getting attention lately for its decentralized storage system (BTFS) and its BTTC layer-2 solution for cross-chain functionality. But it’s not all good news—the massive token supply keeps putting a ceiling on price growth, and past exchange delistings like the one from ProBit Global have hurt both liquidity and investor sentiment.
From a technical standpoint, things are looking somewhat bearish, though we’re seeing some oversold signals that could hint at a potential bounce. Looking at the latest data, the 14-day RSI sits around 41.5, which shows mild bearish pressure but nothing extreme. Both Williams %R and Stochastic RSI are deep in oversold territory, and the ATR is flagging high volatility. Most moving averages are pointing downward—the price is sitting below the short and medium-term MA50, while the longer MA100 and MA200 are hovering nearby and might act as gravitational points for price action.
Technical Indicators & Price Levels
Oscillators & Momentum
The RSI reading around 41 shows bearish momentum without being deeply oversold (that typically happens below 30), so there’s still potential room to drop before a bounce becomes more probable. Williams %R is maxed out at −100, completely oversold, and the Stochastic RSI is telling the same story. The MACD looks pretty neutral without much separation from its signal line, meaning there’s not a lot of momentum building in either direction just yet. The ADX is running high at around 69, confirming that a strong trend is playing out—and right now, that trend is down.
Key Support, Resistance & Moving Averages
Price is currently bouncing around between 3.2e-7 and 3.4e-7 USDT. The main support level to watch is around 3.1e-7 USDT, with resistance bunching up near 3.3e-7 to 3.4e-7 USDT. The moving averages paint a similar picture: the MA50 has crossed above the current price and is now acting as resistance, while the MA100 and MA200 sit just above this zone and could either block any recovery attempts or serve as upside targets if buyers step in.
Technical Consensus Signals
Most short-term moving averages (MA5, MA10, MA20) are flashing ‘Buy’ signals since the price has occasionally poked above them. But the medium-term and trend-defining averages, especially the MA50 that swing traders watch closely, are decidedly bearish. Every oscillator is screaming oversold, which suggests we could see a short-term bounce. That said, weak volume and resistance from higher moving averages make it hard to get excited about anything more than a temporary relief rally unless something major changes the game.
Price Prediction Scenarios
Bearish Projection
If the current downward pressure keeps up, BTT/USDT will likely test support around 3.1 × 10⁻⁷ USDT. If that level gives way, we could see a drop toward ~2.9 × 10⁻⁷ USDT—a psychologically important level that sits in an area with thinner trading volume. Unless the price can climb back above the MA50 or we see a meaningful uptick in volume, further decline looks like the path of least resistance.
Bullish / Recovery Case
For the bulls to take control, we’d need to see consistent buying pressure and a bounce off these oversold readings. The first hurdle to clear is that 3.3e-7 to 3.4e-7 USDT resistance zone—breaking through there with decent volume could open the door to retesting the MA50 and potentially reaching toward the MA100/200 levels. If there’s a real catalyst—maybe strong BTFS adoption numbers or new ecosystem partnerships—price could make a run at ~3.7 × 10⁻⁷ USDT or even higher. But that’s pretty speculative unless we see momentum and volume actually confirm the move.