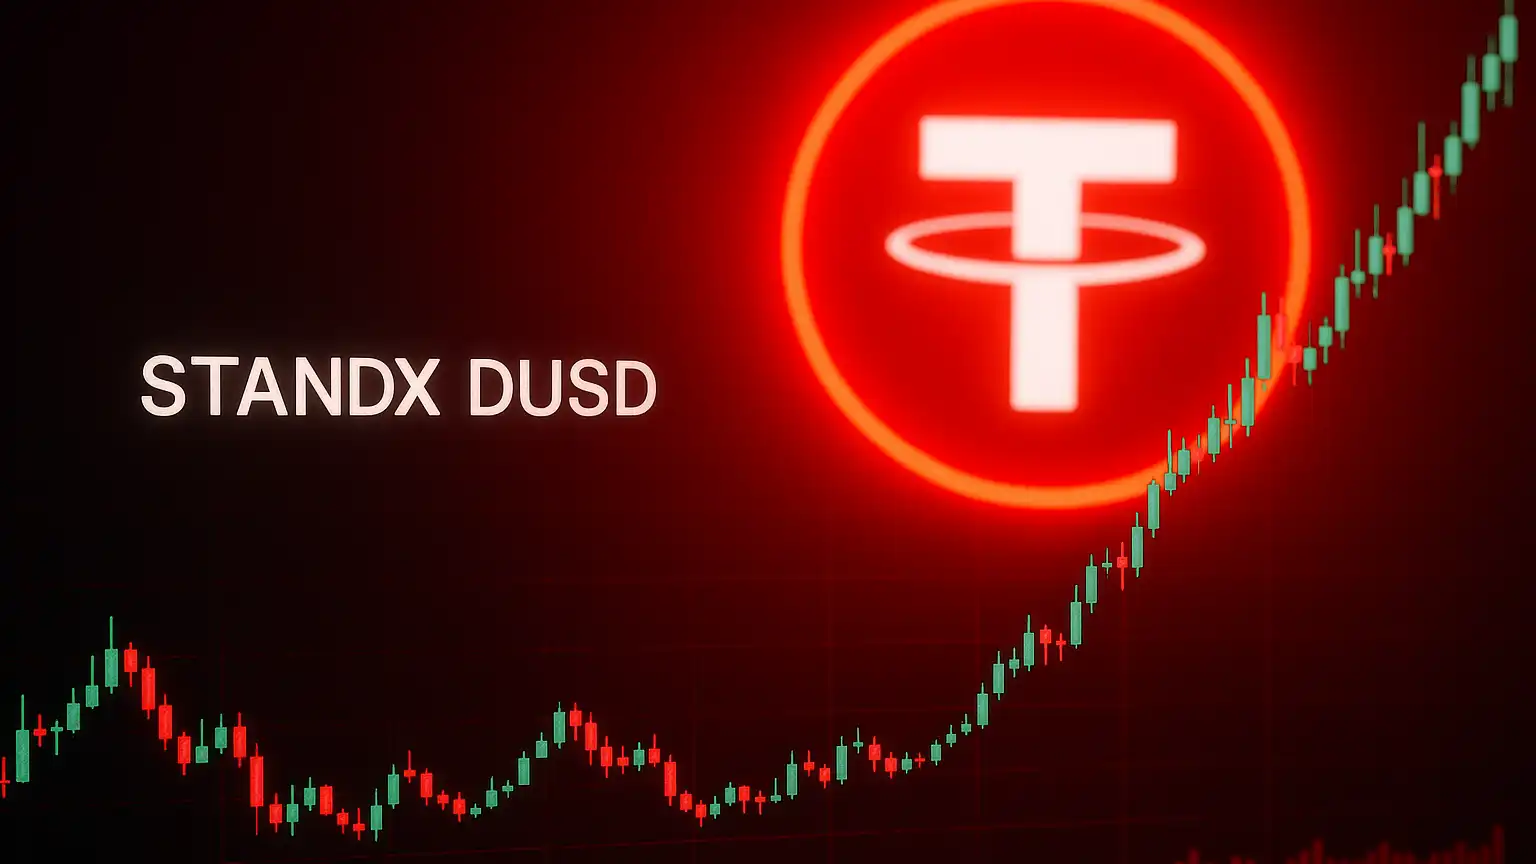
Market Context & Recent Developments
Right now, StandX DUSD is trading at around 0.9996 USDT, sitting just a hair below its intended $1 peg. The past day has been pretty quiet, with the token slipping roughly -0.01% against USDT. We’ve seen daily highs barely touch $1.00 while lows drifted down to about $0.9989. There are somewhere between 153 and 195 million tokens in circulation, putting the market cap in the ballpark of $150M to $195M—the exact number depends on which source you’re checking. Daily trading volume is sitting between $13M and $21M, which gives us decent liquidity but nothing spectacular.
Something interesting has been happening lately on the liquidity front: the USDT/DUSD stablecoin pool over on PancakeSwap (BNB Chain) has seen its Total Value Locked shoot up nearly three times in just seven days. That’s pushed it to become the top stablecoin pair by liquidity on that chain, signaling that more money and attention are flowing into the DUSD ecosystem.
Technical Indicators & Price Behavior
When we look at the momentum and trend indicators, things are painting a pretty neutral picture. The Relative Strength Index (RSI) is hovering around 53—right in the middle ground where the token isn’t overbought or oversold. It’s basically in consolidation mode. The Average Directional Index (ADX) is sitting at roughly 32.7, which tells us there’s some trend strength present, though nothing that’s screaming conviction. Other tools like the Stochastic RSI, Commodity Channel Index, and Williams %R are showing either slight bearish vibes or just neutrality, meaning there’s not much upward momentum building right now.
The moving averages are telling a similar story. Short-term indicators like the EMA and VWMA are flashing mild buy signals, but the longer-term averages are flat and directionless. The MACD histogram is hugging the zero line or dipping slightly negative, with barely any gap between the signal and MACD lines—classic signs of low volatility and a market that’s just not trending. Even the Awesome Oscillator is camped out near the middle, reflecting a market that’s basically in balance without strong forces pushing it either way.
Price Prediction Scenarios & Key Levels
Scenario A: Stable Peg Holding (Base Case)
Most likely, DUSD is going to stick close to its $1.00 peg target. Right now, converting 1 DUSD gets you around 0.9992 to 0.9996 USDT. We’re probably looking at price action in a tight range—maybe $0.9975 on the low end and somewhere near $1.00 to $1.01 on the high end. Support should set up around the $0.9970 to $0.9980 zone, with resistance hanging out just above the dollar mark. Unless something major shakes things up—like a sudden liquidity crunch or external shock—this sideways chop could keep going for weeks.
Scenario B: Bearish Pressure and Potential Dip
If things turn sour—maybe sentiment shifts negatively or liquidity starts drying up—DUSD could break through that support around $0.9970 and slide toward something like $0.9950. What could cause this? Think stablecoin market stress, concerns about depegging more broadly, or just weaker demand in the liquidity pools. If that happens, we’d likely see selling pressure pick up as arbitrageurs and traders start pulling their capital out to safer ground.
Scenario C: Positive Breakout & Overshoot
On the flip side, if things get bullish—maybe big capital flows into those USDT/DUSD or USDC/DUSD pools, stronger backing for the collateral, or some positive news on the regulatory front—we could see the price push modestly above peg. Resistance will show up between $1.00 and $1.01, and if price manages to break through that, we might see it trade at a temporary premium. But realistically, that kind of move usually attracts arbitrage traders pretty quickly, along with stabilization mechanisms that’ll pull it back toward the target.
Risk Factors & Monitoring Triggers
The biggest risk here is depeg risk—if the backing or collateral isn’t solid, or if stabilization fees become too harsh, confidence could crack. Then there’s liquidity risk: even though we’ve seen TVL increase in some pools, if trading volume is too concentrated in just a few exchanges or pools, things could get volatile fast if traders decide to bail. Don’t forget external macro risks either—regulatory crackdowns on stablecoins or broader crypto market turbulence could easily override what the technicals are saying.
Here are some key things to keep an eye on:
- Price dropping below $0.9950: that’s a red flag that the peg might be losing integrity.
- Price closing above $1.01 with solid volume: could signal a premium breakout worth watching.
- ADX climbing above 40 with clear directional confirmation: that means a real trend is forming.
- Oscillators moving opposite to price (like RSI dropping while price stays flat): early warning that weakness might be brewing.