
Recent News & Macro Context
SSV.Network is a protocol that enables distributed validator technology (DVT) within the Ethereum ecosystem, and it’s been catching attention for its decentralized infrastructure approach. That said, we haven’t seen any major headlines recently that would move the needle dramatically. Instead, what’s really weighing on SSV and similar tokens are bigger-picture forces—think rising interest rates, regulators taking a closer look at staking protocols, and an overall tighter environment for riskier assets. All of this creates a cautious backdrop for traders, especially since SSV is dealing with pretty weak volume and momentum right now.
Current State: Indicators & Price Action
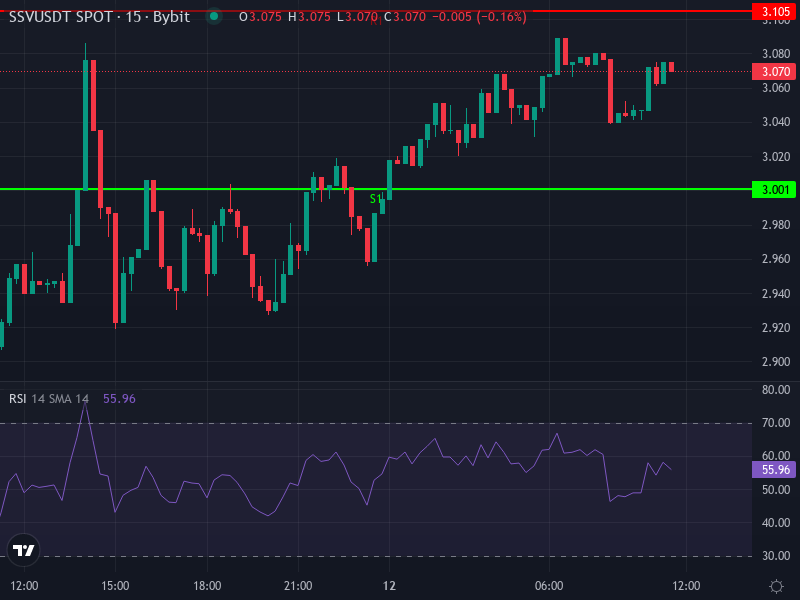
Right now, SSV/USDT is trading around $3.06175, up about +4.38% over the last 24 hours. That’s a nice bounce, but don’t get too excited—the technical picture is still pretty mixed, with some timeframes showing consolidation and others leaning bearish. Let’s dig into what the indicators are actually telling us.
Short-Term Momentum (4-Hour Frame)
Looking at the 4-hour chart, the RSI sits at roughly 45.03. That’s basically neutral territory—not overbought, not oversold, just… there. The MACD line is sitting slightly above its signal line (MACD around −0.0797 versus Signal around −0.1083), giving us a small positive histogram of about 0.0286. On the surface, that looks mildly bullish. But here’s the catch: both the 4-hour Simple Moving Average (around 3.0975) and the Exponential Moving Average (around 3.1408) are hovering above the current price. That means they’re acting as resistance, and it suggests sellers are still calling the shots in the short term.
Daily Pivot Points & Support/Resistance Zones
When we look at the daily pivots, the central pivot point lands around $3.049. Support levels stack up at S1 = $3.001, S2 = $2.945, and S3 = $2.897. On the flip side, resistance comes in at R1 = $3.105, R2 = $3.153, and R3 = $3.209. The overall structure here leans slightly bearish—price needs to push through R1 and R2 to build any real upside momentum, while dropping below S1 or S2 could open the door to more significant selling.
What the Larger Forecasts & Analyst Sentiment Say
Recent technical views generally paint a bearish or neutral picture. Early February data from CoinCodex shows indicators leaning heavily bearish, with only a handful suggesting bullish potential. Their medium-term outlook points to a possible drop toward the mid-$2.30s over the next six months if the current volatility keeps up.
Investing.com echoes this sentiment with strong sell ratings across moving averages and technical indicators. We’re seeing a falling RSI (around 38.25), a deeply negative MACD, and oversold oscillators like Williams %R—all pointing in the same cautious direction.
Projected Scenarios & Price Paths
Based on everything we’re seeing technically and where price is sitting now, there are really two main paths forward:
- Bearish Scenario: If the bears stay in control—meaning MACD keeps showing negative divergence and price gets rejected at resistance around $3.105–$3.20—we could easily see a drop below S1 (around $3.00) and potentially tests of S2 ($2.95) or even S3 ($2.90). If volume continues to dry up, that descent could happen faster than you’d expect.
- Bullish Reversal Possibility: Now, if price can actually punch through the 4-hour EMA (around $3.14) and SMA (around $3.10), that could spark some momentum toward R1 ($3.105) and maybe even R2 ($3.153). Sustained buying could push things toward R3 near $3.20, but that’s going to take some real conviction and volume behind it.
Key Trigger Levels to Watch
- Resistance Zone: $3.10–$3.20
- Support Zone: $2.90–$3.00
- Trigger for Upside: A close above $3.15–$3.20 with solid volume backing it
- Trigger for Downside: A break below around $3.00, which would confirm weakness and likely trigger a move toward $2.90 or lower
Short-Term Forecast & Trade Bias
When you put it all together—RSI in neutral-to-bearish territory, MACD negative or only marginally improving on shorter timeframes, and moving averages acting as resistance—the near-term bias leans mildly bearish to neutral. Most likely, we’re going to see price bounce around between $2.90 and $3.20 over the next few days, with possible tests of those resistance zones if momentum picks up. But without some kind of catalyst—maybe a major on-chain development, regulatory clarity, or a shift in broader market sentiment—a strong bullish breakout seems pretty unlikely right now.
If you’re looking to trade this, patience is key. Wait for confirmation—either a decisive break below $3.00 (which would open up short opportunities) or a strong move above $3.15–$3.20 with volume to back it up. And whatever you do, use tight stop-losses (like below S2 or above R2 depending on your position) because small-cap crypto can whipsaw you in a heartbeat.