Current State & Market Drivers
Right now, SPK is hovering around $0.02434 USDT, which represents a modest dip of about -3.74% in the last 24 hours. The good news? We’ve seen some recovery momentum building over the past week. The protocol’s Total Value Locked (TVL) has been holding steady in the $7.8-$8.0 billion range, which tells us users are sticking around and staying engaged.
From a fundamental perspective, things are actually looking fairly solid. There’s been healthy staking activity, decent usage of products like Spark Savings, and the project continues to benefit from its connection to DeFi infrastructure through the Sky Protocol. If the technical picture starts improving, there’s definitely room for upside here.
On the news side, there are governance proposals in the works to bump up USDC cap limits, and some analysts are pointing out that resistance around key moving averages looks weaker than before—which could open the door for an upward push if things line up right. That said, we can’t ignore the elephant in the room: past token unlocks and the massive distribution that happened during the Ignition and Overdrive airdrop phases continue to create supply overhang risks.
Technical Indicators: Support, Resistance & Momentum
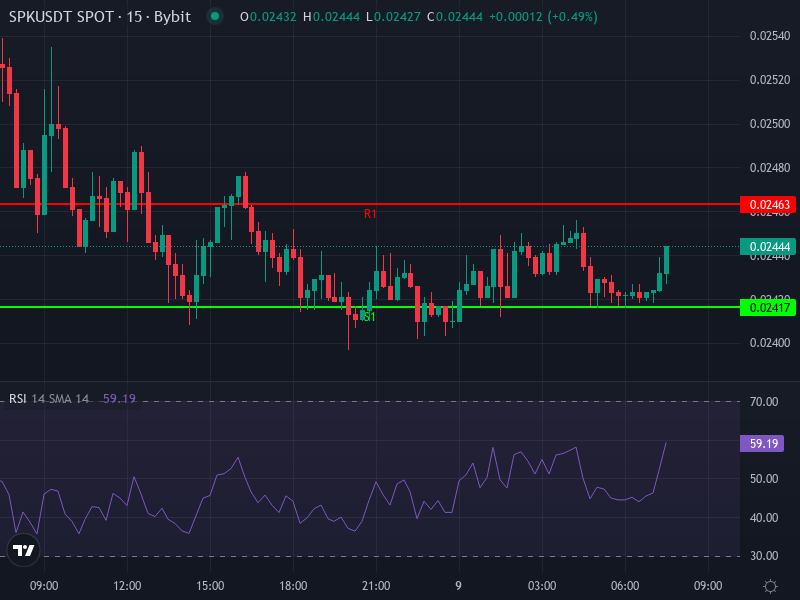
When you zoom into the 4-hour chart, the Relative Strength Index (RSI) is sitting at around 51.33. That’s basically neutral territory—SPK isn’t overbought or oversold, which means it could realistically move in either direction depending on what catalyst emerges next.
The 4-hour MACD tells a slightly different story. The MACD line is just under its signal line, with a negative histogram reading of about -0.000205. This points to some short-term bearish pressure. However, both the 4-hour Simple Moving Average (SMA) and Exponential Moving Average (EMA) are sitting just below the current price (around $0.024186 and $0.024222), meaning SPK is trading slightly above its recent average. If momentum can flip positive, that’s actually a mildly bullish setup in the near term.
Looking at the daily pivot points, here are the critical levels you need to watch:
• Support levels: S1 sits at roughly $0.02417, S2 around $0.02389, and S3 near $0.02370.
• Resistance levels: R1 comes in at about $0.02463, R2 at roughly $0.02483, and R3 around $0.02510.
These define a pretty tight trading range right now. If SPK breaks below S2 or S3, we could see sharper losses. On the flip side, pushing above R2 might set up a test toward the $0.0251 level or even higher.
Short- & Medium-Term Price Predictions
Near-term Scenario (Next 1-2 Weeks)
If SPK can hold above the daily pivot around $0.02436 and manages to close above R1 (roughly $0.02463) with solid volume behind it, we could see upside toward R2 (around $0.02483) and potentially R3 (near $0.02510). Strong buying interest at those levels might even set up a breakout attempt toward the $0.026 zone.
On the other hand, if SPK fails to defend S1 (about $0.02417) and slips below S2 (around $0.02389), we might be looking at a move down to the $0.02350 area or lower, potentially testing recent swing lows. With the MACD already showing negative momentum, declining volume could definitely accelerate any downside move.
Medium-term Projection (1-3 Months)
Looking a bit further out, the fundamentals are actually working in SPK’s favor—solid TVL, healthy staking demand, and growing institutional interest in stablecoin vaults. If the broader market cooperates and risk appetite improves, a move toward the $0.03 level seems realistic, especially if resistance around $0.0251 gets broken cleanly. If SPK can establish support above $0.03, the next logical target would be somewhere around $0.035 in a bullish scenario.
The downside risk hasn’t disappeared though. Those unlocked tokens and potential weakness across DeFi in general could drag SPK back down toward the $0.020-$0.022 range if support crumbles. How well the protocol manages supply pressure through staking incentives or governance actions will be crucial here.
Strategic Signals & Key Levels to Watch
Whether you’re trading or holding for the medium term, here’s what you should be monitoring closely:
• How price reacts around the 50-day EMA—is it acting as resistance or support?
• Volume and price behavior at pivot resistance levels R2 (around $0.02483) and R3 (roughly $0.02510)—a breakout there would signal real strength.
• On-chain metrics like staking inflows, changes in exchange reserves, and the token unlock schedule.
• Updates from governance (like those USDC cap proposals) and any shifts in broader market sentiment.