Recent News & Market Context
Sentient (ticker: SENT) has been making waves lately across multiple fronts. Big names like Pantera Capital and Franklin Templeton’s digital assets division have jumped into Sentient’s “Arena” testing program, which puts AI agents through their paces on complicated enterprise tasks. This kind of institutional backing lends real credibility and might spark increased demand for the token itself.
Before that, SENT saw a sharp spike after landing dual listings on major Korean exchanges—Upbit and Bithumb. Those listings boosted liquidity and opened the door to a broader audience. The token even hit a fresh all-time high, though the added liquidity brought some volatility as traders adapted to the deeper order books.
Technical Indicators & Current Structure
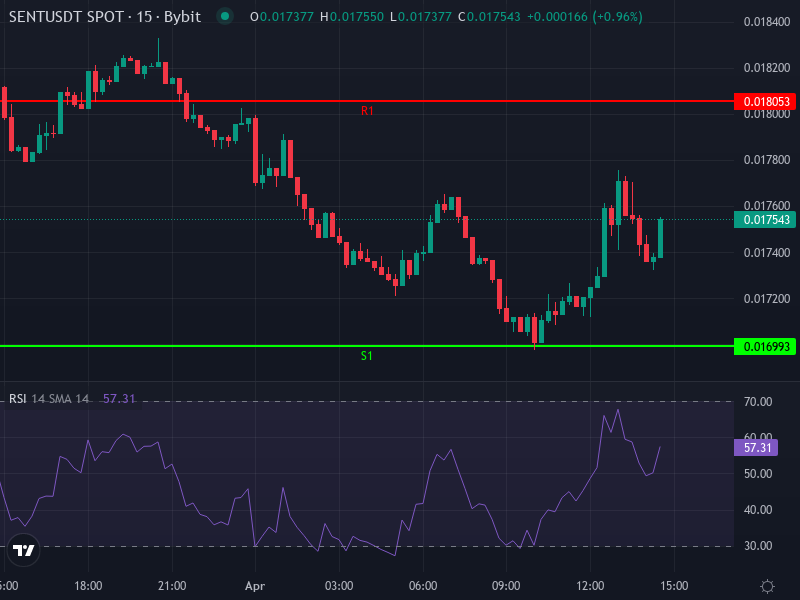
Right now, SENT is trading around $0.017493, down roughly 3.75% in the last 24 hours. Looking at the 4-hour chart, the technical picture is mixed with a slight bearish tilt:
- RSI sits at about 44.7—just under the neutral 50 mark, showing some bearish pressure but nothing extreme. We’re not in oversold territory yet.
- The MACD is negative, with the MACD line sitting below its signal line and the histogram in the red. This points to downward momentum over recent hours.
- The 4-hour simple moving average is hovering near $0.017672, while the exponential moving average is a bit higher at around $0.018026. That suggests there’s resistance overhead.
Daily pivot points give us clearer levels to watch. Resistance clusters between $0.01805 and $0.01911, while support shows up near $0.01699 and extends down to $0.01593.
Price Scenarios: Near-Term & Long-Term Forecasts
Short-Term (Next Few Days to 2 Weeks)
In the immediate future, SENT will probably trade in a range between about $0.0159 and $0.0190, unless something major shifts the dynamic. There’s noticeable selling pressure just above $0.0180, and if we dip below $0.0165, we could see a test of support around $0.0159. Any recovery attempt will need solid volume to overcome the current bearish setup. If the price can push through $0.0191 to $0.0195, that would signal a potential bullish reversal.
Medium to Long-Term (1-12 Months)
If the technical resistance levels get cleared and the ecosystem keeps developing—especially with institutional adoption and new partnerships—several forecasts point to a move back toward $0.032 to $0.040 by the end of 2026. Those projections expect sellers to show up around $0.030 to $0.032, but if demand stays robust, the price could climb even higher.
On the flip side, if the broader crypto market takes a hit or SENT can’t hold its key support levels, we might see a drift down toward $0.012 to $0.015. This would be especially likely if there are complications like regulatory issues, major token unlocks, or a shift in market sentiment.
Strategic Implications for Traders & Investors
For active traders, there might be opportunities to catch quick reversals near support zones, but you’ll want tight stop-losses below $0.0159. If resistance breaks above $0.0191, that could open up short-term long positions targeting $0.0205 or slightly higher. If you’re investing with a longer time horizon, the institutional backing and AI infrastructure roadmap look promising—but timing your entry on dips makes more sense than chasing the price higher. Keep an eye on product milestones, especially results from the agent benchmarking, and any liquidity developments. These will likely be the key drivers in the months ahead. A bit of strategic patience might deliver better risk-adjusted returns than jumping in aggressively at current levels.