Recent News & Fundamentals Setting the Stage
Sahara AI has been making some pretty interesting moves lately that are worth paying attention to. The project is diving deep into what they’re calling “agentic AI”—basically AI agents that can actually do things for you. They’ve rolled out Sorin, which is designed to help with investment decisions, and ClawApp for running AI locally on your device. What’s cool here is that Sahara isn’t just staying in the enterprise lane anymore; they’re building tools regular people can actually use. There’s also talk of an Agentic AppChain coming in late 2026, which would be a pretty significant blockchain infrastructure upgrade. All of this adds up to real utility that should matter for price in the long run.
On the partnerships front, Sahara recently teamed up with Danal Fintech in South Korea to power AI systems for KRW stablecoin transactions. This isn’t just fluff—it’s actual payment infrastructure being used in the real world, which gives SAHARA credibility beyond speculation.
Here’s the catch though: token unlocks have been a real headwind. Late January 2026 saw a massive wave of tokens hit the market, and more are scheduled through mid-2026. Unless there’s enough demand to soak up all that new supply, prices are going to feel the squeeze. So you’ve got this tug-of-war happening—growing utility pulling one way, increasing supply pushing the other. Understanding this tension is key to figuring out where SAHARA goes from here.
With that context in mind, let’s look at what the charts are telling us right now.
Technical Indicators & Key Price Levels
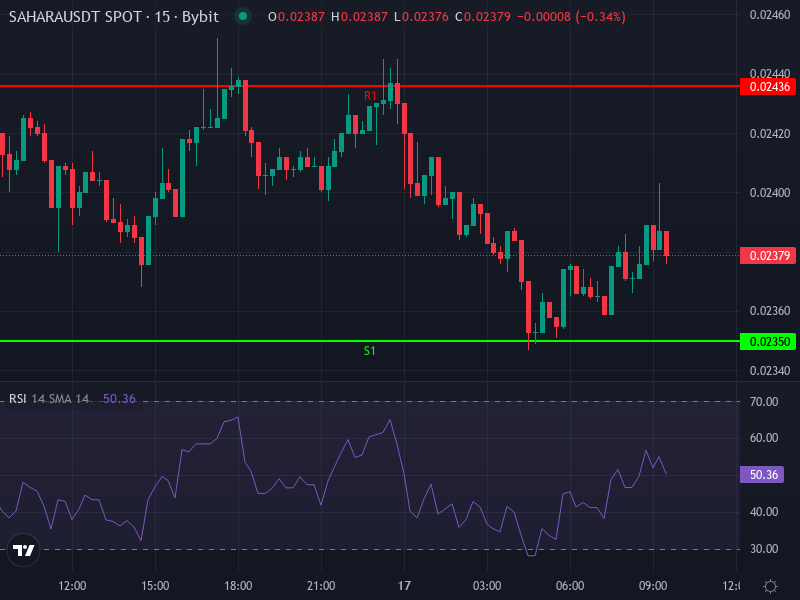
SAHARA is currently trading around $0.02385677 USDT, which is down about 1.07% in the last 24 hours. Looking at the 4-hour chart:
- The RSI is sitting at roughly 48.8, which is pretty much dead neutral. The token isn’t oversold or overbought—it could honestly go either way from here.
- The MACD isn’t looking great though. The MACD line is below the signal line, and the histogram is in negative territory. This usually means momentum has been fading, and unless something changes, we might see more downward pressure.
- The 4-hour simple moving average is around $0.02373833, just below the current price. Meanwhile, the exponential moving average is slightly higher at $0.02399211. When price sandwiches between these two, it typically means we’re in consolidation mode.
For a bigger picture view, here’s what the daily pivot points are showing for key levels:
- Resistance to watch: R1 at around $0.02436; R2 near $0.02483; R3 at roughly $0.02522.
- Support levels: S1 around $0.02350; S2 near $0.02311; S3 at about $0.02264.
- The pivot point itself is sitting at approximately $0.02397, almost exactly where we are now. Breaking above R1 and R2 would signal real upward momentum, while dropping below S1 could trigger a test of lower support zones.
One more thing worth noting: the 1-day Rate-of-Change is showing about +3.33%, which suggests there’s been some upward movement recently. Whether that’s a genuine reversal starting or just a brief bounce is still unclear.
Scenarios Based on Technical Movements
Bullish scenario: If SAHARA can push through and hold above $0.02436 (R1) with decent volume backing it up, the next stops would be $0.02483 (R2) and possibly $0.02522 (R3). Getting past these resistance levels could bring in momentum traders looking for continuation. With all the product launches and real-world payment use cases, there’s definitely fundamental fuel that could support a rally—especially if the market believes demand will outpace those token unlocks.
Bearish scenario: On the flip side, if SAHARA can’t break through R1 and instead drops below S1 (around $0.02350), we’d likely see pressure build toward S2 at $0.02311. Break below that, and S3 near $0.02264 comes into play, which would put us at some pretty uncomfortable lows. With more token unlocks coming and potentially weak volume, the downside risk is definitely something to keep an eye on.
Short- and Medium-Term Price Prediction Range
Putting together everything we’re seeing in the charts, the fundamentals, and the tokenomics challenges, here’s what seems reasonable to expect:
- Next 1-3 weeks: If the bulls can take control and push above R1 with good volume, we could see SAHARA climb toward $0.0250–$0.0260. But if support fails, a drop to $0.0225–$0.0227 wouldn’t be surprising.
- Next 1-3 months: Looking a bit further out, if the product roadmap delivers and adoption picks up, there’s a realistic path to $0.028–$0.032. However, if selling pressure from unlocks overwhelms demand or the market turns sour on AI tokens generally, we might be stuck in the $0.020–$0.022 range instead.
Risks and Catalysts to Monitor
What could push SAHARA higher? Successful launches of Sorin and ClawApp with real user traction would be huge. Progress on the Agentic AppChain, especially if they hit milestones ahead of schedule, could generate excitement. And more partnerships like the one with Danal Fintech—particularly in regulated markets—would add credibility and potentially drive institutional interest. All of these would boost demand and trading volume in meaningful ways.
What could derail things? The token unlock schedule is the big one. If there’s not enough demand to absorb all that new supply hitting the market, prices will struggle. Low trading volume makes it harder to break through resistance levels. And if the broader crypto market turns bearish on AI tokens or speculation cools off, SAHARA could get dragged down regardless of fundamentals. Any delays in product launches would also hurt confidence pretty badly.
Final Insight
Sahara AI is basically at a crossroads right now. Technically speaking, it’s caught between moving averages with neutral momentum indicators—it could genuinely go either direction from here. Given the token unlock pressure ahead, it probably makes sense to wait for confirmation before jumping in. Specifically, watch for a solid close above $0.0244 with strong volume before getting too bullish. If it breaks below $0.0231, that’s when you’d want to seriously consider protecting the downside. Looking at the fundamentals for the next few months, there’s definitely potential here—but the team needs to execute on their roadmap and generate enough demand to outrun the supply increases. That’s really what it comes down to.