Recent Developments & Market Context
Rocket Pool is going through an important transition right now. The “Saturn One” upgrade rolled out around February 18, 2026, and it’s bringing some pretty significant changes to the table. The protocol is gradually switching on fee collection, lowering the barrier for validator nodes from 8 ETH down to 4 ETH, and rolling out these new “megapools” that use capital way more efficiently. People are pretty excited about what this could mean for RPL demand down the road. There’s also buzz about better yields for rETH stakers, improved liquidity, and more active governance pushing the whole thing toward being more decentralized and useful. All of this has traders feeling optimistic again, though some technical signals are flashing warnings that things might be getting a bit overheated in the short term.
Technical Price Action & Key Indicators
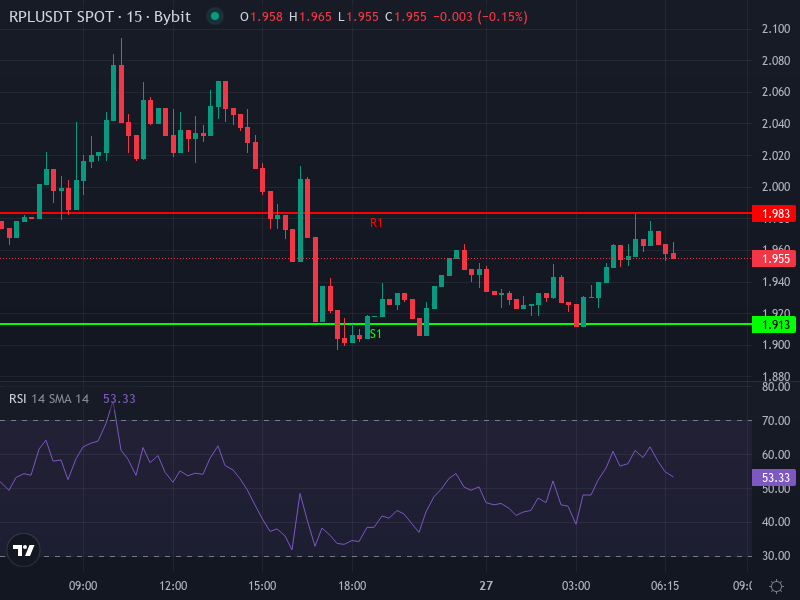
Right now, RPL/USDT is sitting at around $1.96, which is down about 0.69% in the last 24 hours. Looking at the four-hour chart, here’s what we’re seeing:
- RSI is around 42.8 — that’s below the 50 mark, so momentum isn’t exactly strong on this timeframe.
- The MACD line just barely crossed above the signal line (MACD at -0.0493 versus Signal at -0.0571), with a tiny positive histogram of about 0.0078 — could be hinting at a mild bullish turn.
- Price is trading below both the 4-hour simple moving average (roughly $2.02) and exponential moving average (about $2.03), so those are acting as overhead resistance right now.
- Looking at pivot points: the daily pivot is around $1.9467; resistance levels are stacking up near $1.98, $2.0167, and $2.0533; support levels sit at roughly $1.9133, $1.8767, and $1.8433.
When you zoom out to daily and weekly charts, RPL is still having trouble getting above its major moving averages. Despite all the hype around Saturn, the token is technically still in a downtrend. Worth noting that RPL remains below its 50-day and 200-day moving averages across most analyses, so while things are looking a bit better short-term, we’re not out of the woods yet.
Support & Resistance Zones
Here are the key levels to watch over the next few weeks:
- Immediate resistance: There’s a zone around $2.50–$2.55 that lines up with the 0.618 Fibonacci retracement from the recent swing, and then stronger resistance waiting at about $2.85.
- Critical downside support: Around $2.30 at the 0.50 Fib level is important; below that, we’re looking at support near $2.09 at the 0.382 Fib.
- The $2.30–$2.55 range is really the battleground right now. It overlaps with Ichimoku cloud support, so staying above this area would be a win for the bulls.
Scenario-Based Price Projections
Based on what the technicals and market sentiment are telling us, here are a few possible scenarios for RPL moving forward:
- Bullish Scenario: If RPL can hold above $2.54 and buyers keep showing up, we could see a push toward $3.27, maybe even stretching to $3.40–$3.45. This would really depend on whether the Saturn upgrade continues to drive volume and TVL growth the way people are hoping.
- Neutral to Bearish Scenario: If that $2.30–$2.50 support zone breaks, things could get ugly fast. We’d probably see a retest of $2.09, and if selling pressure really picks up, it wouldn’t be shocking to see RPL drift back toward $1.90 or lower. The daily RSI is already above 75 and Stoch RSI is at extremes, so a pullback wouldn’t exactly be surprising.
- Longer-Term Outlook (Next 1–3 months): Predictions are all over the place, but most analysts think RPL will probably trade somewhere between $2.40 and $3.00 if the protocol delivers on its promises around usage, revenue, and staking demand. On the flip side, if the broader crypto market gets weak or if there are hiccups with the Saturn rollout, the upside could be capped or we could see deeper losses.
Implications for Investors
If you’re actively trading this, the next few days are really important. Watch how RPL reacts around that $2.30–$2.55 zone—it’ll tell you whether these recent gains have legs or not. If we can break through resistance at $2.80 with decent volume behind it, that $3.40 target starts looking realistic.
For folks thinking longer-term, the protocol fundamentals are what really matter. Keep an eye on TVL trends, how much demand there is for rETH, whether node operators are growing, and how that fee switch actually plays out in terms of revenue. If those pieces fall into place, they could provide a solid foundation for RPL to climb back to higher levels.