Recent Fundamentals & Ecosystem Developments
RedStone (ticker RED) works as a modular oracle network that blends off-chain signed data delivery with on-demand smart-contract querying. The project has been rolling out several community-focused initiatives lately. Their Miner Airdrop rewarded active community members just before the Token Generation Event kicked off, and the RedStone Miners Program is now working to establish formal contributor roles while creating actual utility for RED token rewards through various tasks, visual content campaigns, and developer community outreach. It’s clear they’re trying to align everyone’s incentives and build a more engaged user base.
RED is now listed on major exchanges like Binance and CoinW, and you can trade it via the RED/USDT pair along with others, which has helped boost liquidity. Users can stake through Launchpool events and take part in staking and delegation features that support the protocol’s tokenomics. While the long-term outlook seems promising given how modular oracles are being adopted in DeFi, recent news has mostly been promotional stuff rather than any real game-changing announcements.
Technical Analysis & Price Action (As of Current Price: US$0.10261955870580251)
Moving Averages: Looking at the 4-hour chart, the Simple Moving Average sits around US$0.10532 while the Exponential Moving Average is slightly higher at about US$0.10663. Since the current price is trading below both of these levels, we’re dealing with immediate overhead resistance and some pretty weak short-term momentum.
MACD & Histogram: The MACD line is hovering around −0.001015, still below the signal line at roughly −0.001485, though the histogram has flipped slightly positive at about +0.00047. This tells us that selling pressure might be letting up a bit, but we haven’t seen any confirmed bullish momentum shift yet. Any real upward movement would need the MACD to cross above its signal line with some decent volume backing it up.
RSI: The Relative Strength Index is sitting at 41.42 on the 4-hour timeframe, which puts it in neutral to slightly bearish territory. It’s not oversold enough to guarantee a bounce, but it’s nowhere near overbought either. There’s definitely room for some consolidation or maybe a small rally if buyers decide to show up.
Pivot & Support/Resistance Zones
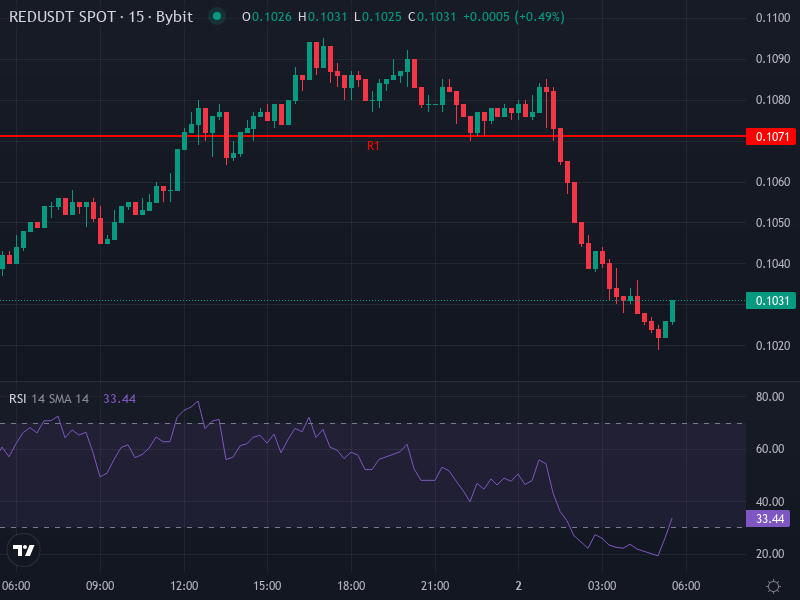
Based on daily pivot calculations, the central pivot point sits at around US$0.10450. Resistance levels are stacked up at approximately US$0.10710 for R1, US$0.11110 for R2, and US$0.11370 for R3. On the support side, we’re looking at roughly US$0.10050 for S1, US$0.09790 for S2, and US$0.09390 for S3. Since the current price is hanging out below the pivot, these support zones are going to be really important for spotting potential reversals or figuring out if there’s more downside ahead.
Projections & Potential Scenarios
There are basically two likely scenarios that could play out over the next few days to weeks based on what we’re seeing:
- Bearish continuation: If RED stays stuck below that SMA/EMA zone around US$0.105–0.107, we’ll probably see a drop toward support at US$0.1005. Breaking below that could push us down to US$0.0979 or, if things get really messy, all the way to US$0.0939. The indicators would be screaming downtrend continuation if this scenario plays out.
- Short-term bullish reversal: If buyers manage to push the price above both the 4-hour EMA (around US$0.1066) and SMA (roughly US$0.1053), we could see a relief rally heading toward US$0.1071 at R1, and possibly US$0.1111 at R2. For this to be legit, the MACD would need to cross above the signal line positively, and we’d need to see volume pick up. RSI climbing above 50 would add more weight to an upside move.
Honestly, a consolidation phase just under the SMA/EMA range—somewhere between US$0.102 and US$0.106—wouldn’t be surprising at all. The current technical indicators are showing reduced volatility and a lot of indecision, with neither buyers nor sellers really in control. Traders might see some choppy, back-and-forth action in that range until something happens—whether that’s news, on-chain metrics, or a broader macro trend—to push things one way or the other.
Mid-Term Outlook & Key Triggers
Over the next several weeks, where RED goes will probably depend a lot on broader market sentiment—think crypto-wide risk appetite, economic data releases—plus how much momentum the oracle and data infrastructure sector can gather, and any project-specific updates like new integrations or improved staking incentives. If the oracle sector catches a bid and gets some renewed attention, RED could easily reclaim those resistance zones around US$0.11–0.12. But if macro headwinds start blowing hard, we might see supports below US$0.10 get tested more aggressively.
Key things to watch: a MACD crossover, volume picking up on upward moves, RSI breaking and holding above 50, and reclaiming both the EMA and SMA will be critical signals. On the flip side, if price fails at the pivot (around US$0.1045) and volume starts dropping, that’s pointing toward more downside risk ahead.