Recent Developments and Market Context
Ravencoin has an important halving event coming up on January 15, 2026. When this happens, the mining rewards will be cut in half—dropping from 2,500 RVN down to 1,250 RVN per block. This reduction in new supply entering the market could push prices higher if demand stays steady. But there’s a flip side to this: some miners might find it unprofitable to keep mining at these lower reward levels, which could lead to a drop in the network’s hash rate and overall security.
On a more positive note, the Ravencoin team continues to highlight the coin’s integration with IPFS (InterPlanetary File System). While real-world adoption has been pretty slow so far, there’s growing interest in niche communities focused on asset tokenization and decentralized data storage.
That said, the technical picture right now isn’t exactly encouraging. Most major indicators—moving averages, RSI, and MACD—are all pointing to weak momentum. It doesn’t look like the market is ready for a sustained rally just yet.
Key Indicators & Price Structure
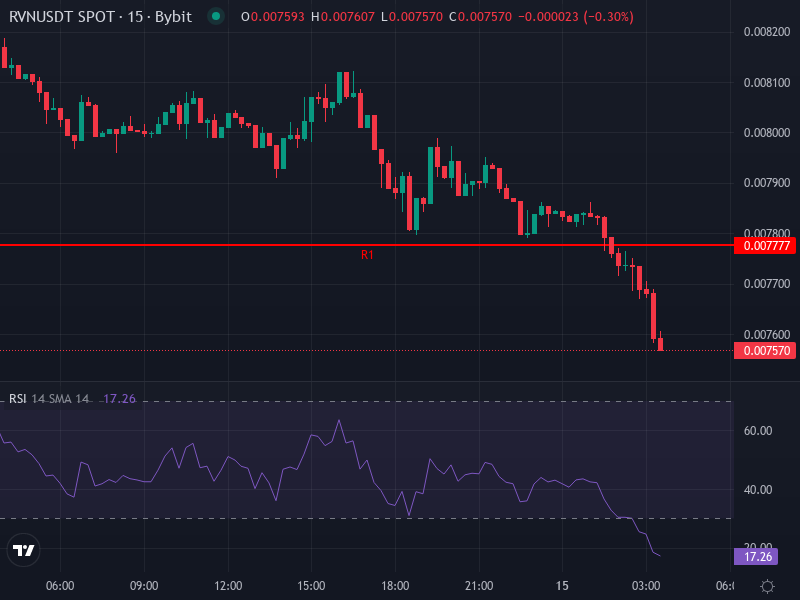
Right now, RVN/USDT is trading at around $0.007577, down about −6.64% over the last 24 hours.
Looking at the 4-hour chart, the Relative Strength Index (RSI) is sitting near 43—neither oversold nor particularly strong. The MACD is slightly below its signal line with a small negative histogram, showing weak bearish momentum that hasn’t really committed to a strong downtrend yet.
Here are the daily pivot-point levels to watch (USDT pair):
• Resistance zones: around $0.007776, $0.007973, and $0.008076
• Support zones: around $0.007476, $0.007373, and $0.007176
Worth noting: the current price is trading below short-term moving averages (4h SMA is around $0.00772; EMA around $0.007756), which are acting as immediate overhead resistance.
Short‐Term Scenarios (Next Days to Weeks)
Based on what we’re seeing in the charts, there are two likely paths forward in the short term:
- Bearish continuation: If RVN can’t break back above the $0.00775–$0.00780 resistance zone (where those 4-hour moving averages sit), we could see it slide down toward support levels at $0.00748 or $0.00737. If it breaks below the stronger support at $0.00717, things could get uglier, potentially dropping toward $0.00650–$0.00680—especially if concerns about miner profitability after the halving start to weigh on sentiment.
- Relief bounce or consolidation: On the other hand, if buyers start to show up—maybe driven by speculation around the halving—RVN could reclaim that $0.00775 level and push toward the next resistance near $0.00805. If it can hold above $0.00820, we might see further upside toward $0.00850 in the near term.
Mid‐ and Long‐Term Outlook
Looking further out into 2026, analysts are cautiously optimistic, assuming the halving effects start to show up and demand holds relatively steady. Some models are projecting RVN to average around $0.0078–$0.0082 in the coming months, potentially rising later in the year toward a range near $0.011–$0.013 if conditions are favorable.
Another forecast suggests a wider trading range for 2026, anywhere from about $0.00517 on the low end (in a bearish scenario) to $0.007865 on the high end (if key resistance breaks). Average prices are expected to hover closer to current levels unless something really shifts market sentiment.
Implications from the Halving & Miner Behavior
The halving represents a classic supply shock for proof-of-work coins. Ravencoin uses the KAWPOW algorithm, which is designed to be GPU-friendly and resistant to ASICs. How much the halving actually affects supply really depends on whether miners can stay profitable. If electricity costs and hardware efficiency allow miners to keep going at these lower rewards, the network stays strong. If not, we could see hash rate decline, which brings short-term risks for transaction speed and network security.
For anyone watching this space, it’s worth keeping an eye on metrics like hash rate, miner revenue versus costs, and post-halving network statistics. These will tell you more about what’s really happening than the hype will. Also, don’t forget about the bigger picture—macro economic conditions, regulatory developments, and competition in the asset tokenization space all play a role in shaping demand.
Risk Zones & Watchlist
Key resistance to watch: $0.00775–$0.00780 (where those 4-hour moving averages cluster), then $0.00805–$0.00820.
Important support levels: $0.00748 → $0.00737 → $0.00717.
If the price breaks below the lowest support level with heavy volume, that would suggest a deeper correction is coming. On the flip side, a clean breakout above resistance with strong volume could shift short-term momentum to the bullish side.