Recent News and Structural Developments Driving Qubic (QUBIC)
The Qubic ecosystem has been making some real headway lately when it comes to infrastructure and tokenomics. The project’s “Useful Proof-of-Work” model keeps churning out mining rewards, and here’s the interesting part—a portion of those rewards gets burned, which creates a deflationary pressure on the supply. The community has been pretty active too, pushing forward proposals about cutting emissions and implementing weekly supply burns. Plus, QEarn has locked up a pretty significant chunk of circulating QUBIC, which effectively takes tokens out of active circulation. All of this points to a project that’s taking its economic model seriously for the long haul. What’s really catching attention though is the work being done on network connectivity. The team has been making solid progress on bridges to both Ethereum and Arbitrum—they’ve moved through smart contract design phases and are working through cross-chain interaction testing. These bridges could really open things up in terms of DeFi utility. So even with the broader market being choppy, there’s some genuine fundamental progress happening behind the scenes.
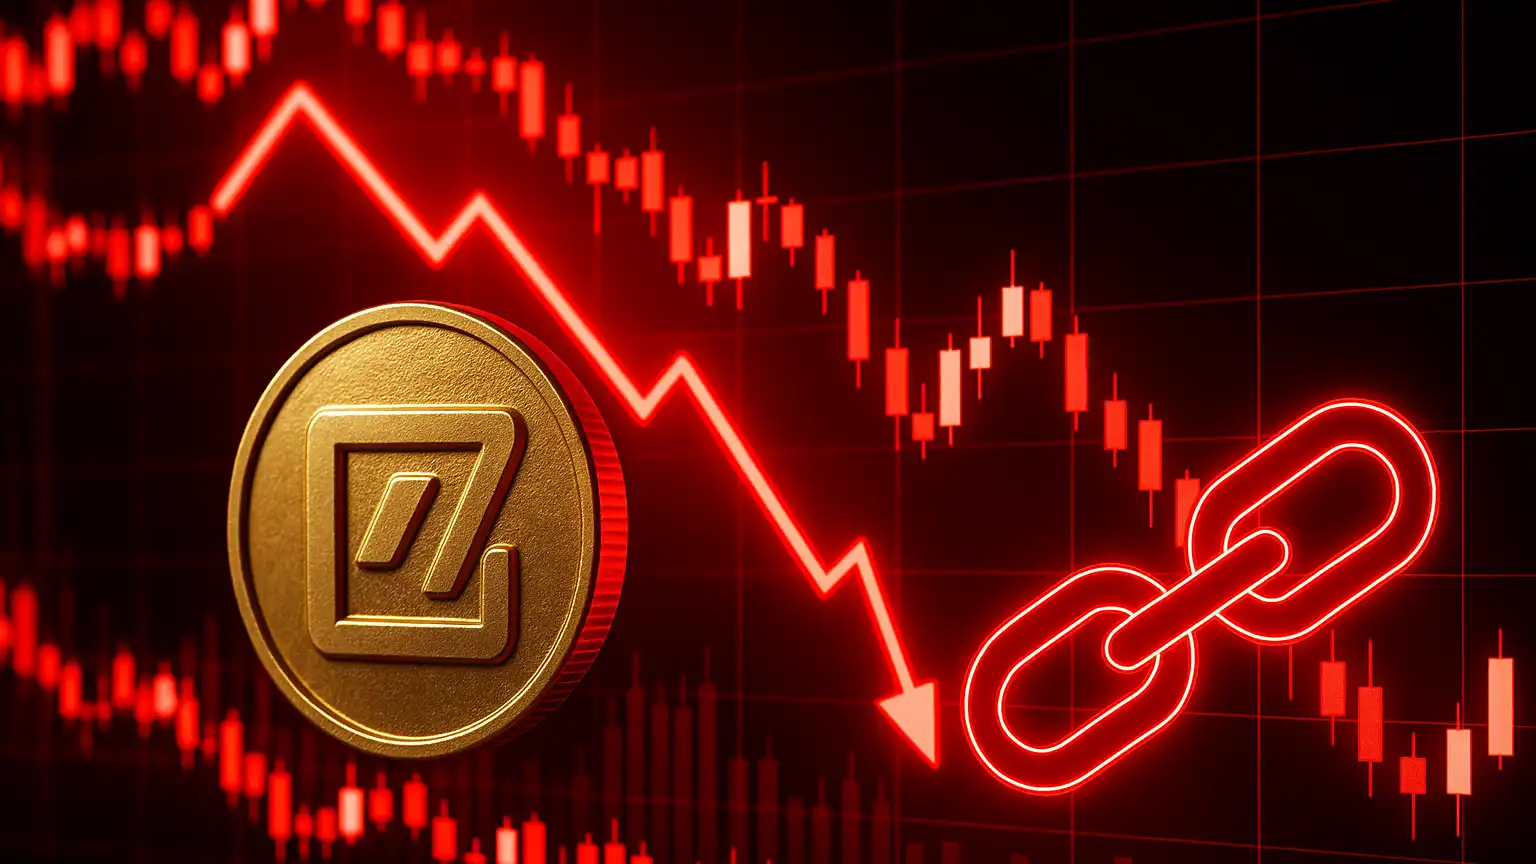
Technical Indicators: Oversold But Trend Remains Bearish
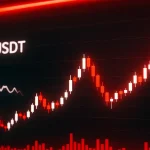
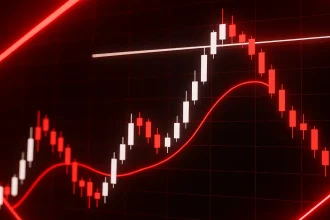
Right now, QUBIC is hovering around 0.00000072 USDT per token. We’ve seen a modest bump of about +1.57% in the last 24 hours, but honestly, it’s probably too early to call this any kind of reversal. When you look at the daily chart, the price is sitting well below the major exponential moving averages—the 50, 100, and 200-period lines—which typically tells you the overall trend is still bearish. The Relative Strength Index is deep in oversold territory, hanging out below 30, which suggests sellers might be getting exhausted, but we haven’t seen any real confirmation that buyers are ready to step in yet. The MACD has gone pretty flat, so we’re not seeing strong momentum in either direction at the moment. One thing that stands out is the Average True Range—it’s elevated, meaning volatility is running high. That cuts both ways: bigger risk, but also bigger potential moves. The Bollinger Bands show price hugging that lower band, which often hints at a potential short-term bounce, but it doesn’t necessarily mean we’ve found a solid floor yet.
Key Support and Resistance Zones
There seems to be some decent support building in the $0.00000060–$0.00000065 range. This zone lines up with previous lows and some Fibonacci retracement levels, so it’s not arbitrary. If the price breaks below that support, things could get dicey pretty quickly, with the next likely stop around $0.00000050 or even lower. On the flip side, resistance is stacked in layers above current price. First hurdle is around $0.00000080–$0.00000090, and then beyond that we’re looking at roughly $0.00000110–$0.00000120, where the EMA-100 and EMA-200 sit along with some mid-term Fibonacci zones. For any upward movement to really stick, we need to see price punch through that $0.00000080 level with convincing volume. Without that, any rallies will probably run out of steam pretty quickly.
Price Forecast Under Alternative Scenarios
Looking at current volatility and momentum, there are two scenarios that seem most realistic over the next one to four weeks—either bearish continuation or a modest recovery.
Bearish Continuation Scenario
If the selling keeps up and QUBIC can’t hold that $0.00000060 to $0.00000065 support zone, we could easily see it slide down toward $0.00000050. A clean break below that level might trigger some panic selling, potentially pushing price down to $0.00000040 or worse as traders throw in the towel. In this kind of scenario, those oversold readings could just stay pinned low, the MACD would likely stay flat or negative, and the moving averages would keep acting like a ceiling. This path becomes more probable if the broader market turns sour or if there’s negative sentiment around mining activity or miner behavior. Watch for volume during any downward moves—if it spikes on the way down, that tends to accelerate the decline.
Modest Recovery Scenario
Now, if Qubic catches some positive momentum—maybe those bridge launches go smoothly, QEarn TVL keeps growing, or governance delivers clarity on those supply burns—we could see accumulation lift price back up from that lower support zone toward $0.00000080. Breaking through that resistance with solid volume could open the door to $0.00000110-$0.00000120. The signs to watch for would be RSI climbing back toward 50, MACD showing a bullish crossover, and price managing to close above both the EMA-50 and EMA-100. Even in this more optimistic scenario though, a full trend reversal would need sustained fundamental growth and clearer real-world utility in the broader DeFi and AI space.