Current Market Context & News Highlights
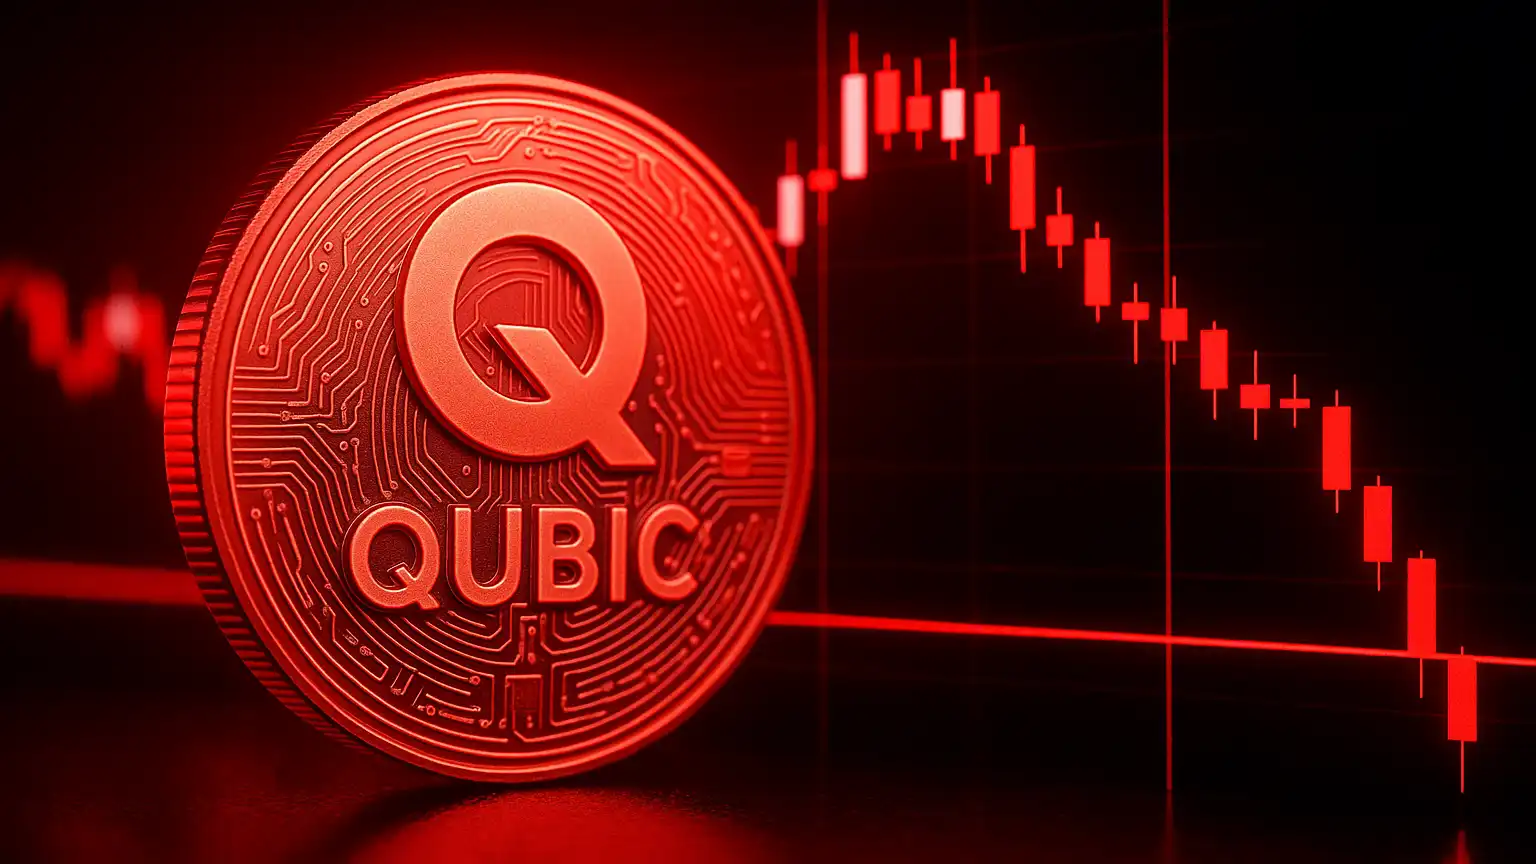
QUBIC is currently sitting at around $0.0000004827, down roughly 3.63% over the past 24 hours. This isn’t happening in isolation—it’s part of a wider market retreat where nervous investors are pulling back from riskier assets. Recent U.S. inflation numbers and changing expectations about interest rate cuts have sparked a selloff across both stocks and altcoins. The so-called “altcoin season” just hasn’t materialized, and money keeps flowing toward what people see as safer bets. For smaller tokens like QUBIC that rely heavily on liquidity, this environment is particularly tough.
On a more positive note, the Qubic team has been busy shipping some potentially significant protocol upgrades. Just last month, they went live with execution fees on mainnet smart contracts—essentially creating an automatic token burn mechanism that kicks in whenever the network gets used. They’ve also been working on their DAG-inspired Layer 1 architecture, which blends something called Quorum-Based Computation with Useful Proof-of-Work. There’s even talk of mining integration with Dogecoin and new DAO governance structures. These are all solid technical improvements that could matter down the road, but here’s the catch: none of it means much unless people actually start using the network. Right now, these upgrades look promising on paper but haven’t been enough to stop the technical bleeding.
Technical Indicators & Price Structure
When you look at the charts, the picture isn’t pretty. The daily RSI is hovering in the mid-30s—not quite screaming “oversold,” but definitely showing some weakness. What’s worse is that nearly all the moving averages—whether you’re looking at the 10-day, 50-day, or 200-day—are sitting above the current price, acting like a ceiling. The MACD is giving off neutral-to-bearish vibes, and while volatility has picked up, the Average True Range suggests any bounce is going to run into serious headwinds pretty quickly.
Zooming into the shorter timeframes—4-hour and 1-hour charts—you can see price struggling below the lower Bollinger Band, with RSI getting close to oversold territory. Usually that might signal a bounce is coming, but here’s the problem: volume just isn’t there. The buying interest is basically absent. Recent volume spikes have been almost entirely on the sell side, which looks more like people giving up than smart money accumulating.
Support & Resistance Zones
The main support zone to watch sits around $0.0000004–$0.00000045. This area lines up with previous consolidation and some psychological price levels. If that breaks, things could get uglier fast, with the next stop around $0.00000030–$0.00000035. On the flip side, resistance is stacked between $0.00000055–$0.00000065, where you’ve got multiple moving averages creating a wall. For bulls to really take control, we’d need to see price punch through that zone with conviction and actual volume behind it—not just a quick wick up.
Price Prediction & Scenarios for 2026
Looking ahead over the next few months and into 2026, here’s how things might play out across different scenarios.
- Bear Scenario: If the current weakness continues, we’re probably headed down to test that $0.00000030–$0.00000035 support zone. This becomes even more likely if the broader market catches another wave of fear—say, if the Fed surprises with hawkish comments or we get another macro shock. In this scenario, expect QUBIC to basically tread water in a tight, depressing range until either the network starts showing real usage or market conditions improve.
- Base Case: There’s a reasonable chance we see a bounce toward $0.00000055–$0.00000065, especially if those execution fee burns start adding up or if the governance changes restore some confidence. That could set up a retest of the short-term moving averages. But let’s be honest—without a serious pickup in volume, it’s probably going to stall out at resistance rather than breaking through.
- Bull Scenario (Long Shot): Now, if Qubic actually manages to attract meaningful developer activity and dApp usage that takes advantage of its unique uPoW setup, combined with those execution fees really kicking in and a friendlier macro environment, then yeah—we could see a breakout above $0.00000080–$0.00000100. But that’s a lot of “ifs.” You’d need ecosystem growth, better liquidity, consistent token burning, and frankly a bit of luck with timing. It’s possible, but definitely not the way to bet right now.
No matter which scenario plays out, the critical things to watch are smart contract usage rates (since that’s what drives the deflationary mechanics) and volume behavior during any upward moves. Without seeing improvement there, any rally will probably fizzle out pretty quickly.
Emerging Catalysts & Risks
Catalysts: The big potential game-changers would be genuine adoption of Qubic’s Layer-1 features, successful rollout of those mining integrations including Dogecoin, growing developer interest, and improved transparency through better governance structures. Any of these could shift the narrative and improve the technical picture.
Risks: The liquidity situation is a real problem—low liquidity means even modest selling can tank the price. Broader economic headwinds around interest rates, inflation, and potential regulatory crackdowns aren’t helping altcoins generally. There’s also some lingering skepticism around certain Qubic claims—like those 51% hashrate concerns—and any security incidents could really damage confidence. And let’s not forget execution risk: this project has a lot of moving parts that haven’t been proven in the real world yet.
Outlook Insight
Bottom line: QUBIC is in a downtrend, and the odds of a near-term recovery don’t look great unless something changes materially. Most likely, we’re looking at choppy trading between $0.00000030 and $0.00000065 for the next few months. The first real sign that sentiment is turning would be a clean break above resistance with strong, sustained volume. On the other hand, if that support around $0.00000040 gives way, we’re probably in for deeper losses and an extended period in bearish territory. For now, it’s a waiting game—watching for network adoption metrics and volume to show signs of life.