
Current Technical Landscape & Data-Driven Signals
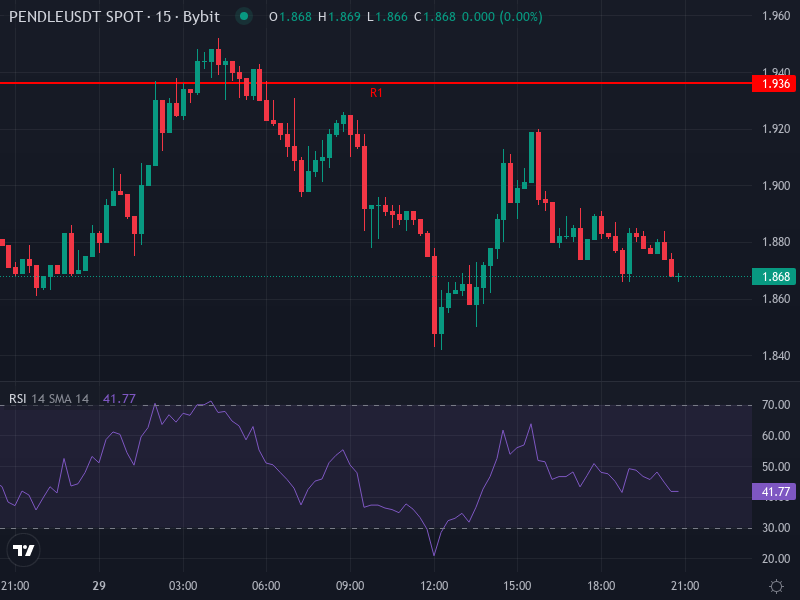
PENDLE is trading around $1.866 right now, down about 0.63% over the last 24 hours. The token seems stuck in a bit of limbo—not clearly heading up or down, just kind of hovering near potential support. Looking at the 4-hour chart, the RSI sits at roughly 51.47, which tells us things are pretty neutral—neither overbought nor oversold. The MACD line has dipped slightly below its signal line with a small negative histogram of about −0.0043, while the 4-hour SMA near $1.845 sits just under the current price. The 4-hour EMA at around $1.860 is practically kissing the price level, which really highlights how directionless things feel at the moment.
When we map out the daily pivots, support appears around $1.824–$1.779, with a cluster of resistance hanging out near $1.935–$2.000. The momentum indicators lean a touch bearish—moving averages are pointing downward across several longer time periods—but oscillators are giving us mixed messages. There’s some mild positive divergence showing up in the MACD, and with RSI staying neutral, it looks like any further downside might be limited. That said, we’d need a convincing break above those key resistance zones to really get excited about upside potential.
Resistance & Support Context: Daily & Weekly Grids
The daily charts are painting an interesting picture. There’s a major pivot point sitting near $1.899, with classic resistance barriers stacked between $1.935 and $2.00. If the price manages to push through that ceiling with real conviction, we’d be looking at the next challenge zone in the $2.10–$2.50 range—an area that lines up with some previously broken EMAs that used to act as resistance.
On the flip side, support levels are bunched around $1.85 and $1.80, with a more solid floor near $1.77. If we see a drop below $1.80, that would raise some red flags about a deeper pullback potentially heading toward $1.60–$1.70. The ATR is showing elevated volatility, meaning we’re seeing some pretty wide price swings within single days, especially when volume thins out. Keep an eye on those support tests around $1.84–$1.87—these could be decent entry zones if the price action shows signs of holding steady there.
MACD & Momentum: Turning Points or False Breaks?
Even though the 4-hour MACD histogram looks bearish, the crossover patterns hint that momentum might be finding a bottom. Daily indicators are backing this up with some mild bullish divergence showing through. But here’s the catch—most of the moving averages, particularly those mid- to long-term EMAs, are still sitting above current price, which confirms we’re still in a broader downtrend. For any bullish scenario to really gain traction, the price needs to not just poke above that $1.93–$2.00 resistance zone—it needs to close above it convincingly and then reclaim those key moving averages (the 50-, 100-, and 200-period EMAs on the daily charts). Without that kind of follow-through, we’re probably looking at another test of support or just more sideways grinding.
Recent News & Developments Influencing Sentiment
PENDLE has been making some noise in the DeFi space lately with its yield-focused approach and solid revenue performance. According to on-chain data and user reports, the protocol pulled in roughly $33 million in real revenue during 2025—which puts it among the more productive yield platforms out there. This kind of actual income generation, not just token emissions, is a big deal and sets PENDLE apart from a lot of other DeFi projects that talk a big game but don’t deliver real numbers.
On top of that, the project’s been expanding its reach across different blockchains. There was a recent announcement about PENDLE integrating with UniChain, which should broaden its utility and potentially drive more demand for the token, especially from users hunting for fixed yields on their yield-bearing assets. These are definitely positive developments, but they haven’t translated into significant price movement yet—probably because the broader market’s been pretty sluggish and investors are playing things cautiously.
Price Prediction Scenarios Based on Technical Readings
Based on what the charts are telling us, here are two realistic paths PENDLE might take over the next few weeks:
-
Bullish Breakout Scenario:
If PENDLE manages to close daily candles above that $1.93–$2.00 resistance zone, we’d be looking at targets around $2.20, followed by $2.50. We’d want to see confirmation through increased volume, bullish MACD crossovers on the higher timeframes, and RSI pushing above 55. Crucially, those moving averages—especially the 50-day EMA—would need to flip from resistance to support for this scenario to really play out. -
Bearish / Range Continuation Scenario:
If that resistance holds firm and the price gets rejected, we’re likely headed back down to test support between $1.80–$1.85. A break below around $1.80 could open the door to $1.70 or even the mid-$1.60s. Under this scenario, momentum indicators would likely show continued weakness, particularly if the MACD can’t maintain any bullish momentum or if those moving averages stay stubbornly above price.
Most Likely Near-Term Path: Given how neutral the oscillators are right now, with resistance sitting just overhead and moving averages not exactly lining up in a bullish formation, our best guess is we’ll see another test of support followed by a modest bounce. A tight trading range between roughly $1.80 and $2.00 seems like the most probable outcome unless something changes—whether that’s a major protocol announcement or a broader shift in market sentiment that brings fresh demand into the picture.