Recent News & Market Sentiment
Moo Deng burst onto the scene in late 2024 as a Solana-based meme coin inspired by Thailand’s adorable pygmy hippo. What started as a viral internet sensation quickly transformed into a token with serious trading volume and speculative interest. When Robinhood added it to their platform, the market cap jumped to around $230 million, triggering some impressive short-term gains. Coinbase followed suit with their own listing, and even Vitalik Buterin threw his support behind it, which really pumped up the momentum. But here’s the thing—once the initial excitement wore off, we saw some pretty steep corrections. This boom-and-bust pattern has made it crystal clear that MOODENG’s price movements are driven more by hype and external events than any underlying fundamentals or real-world utility.
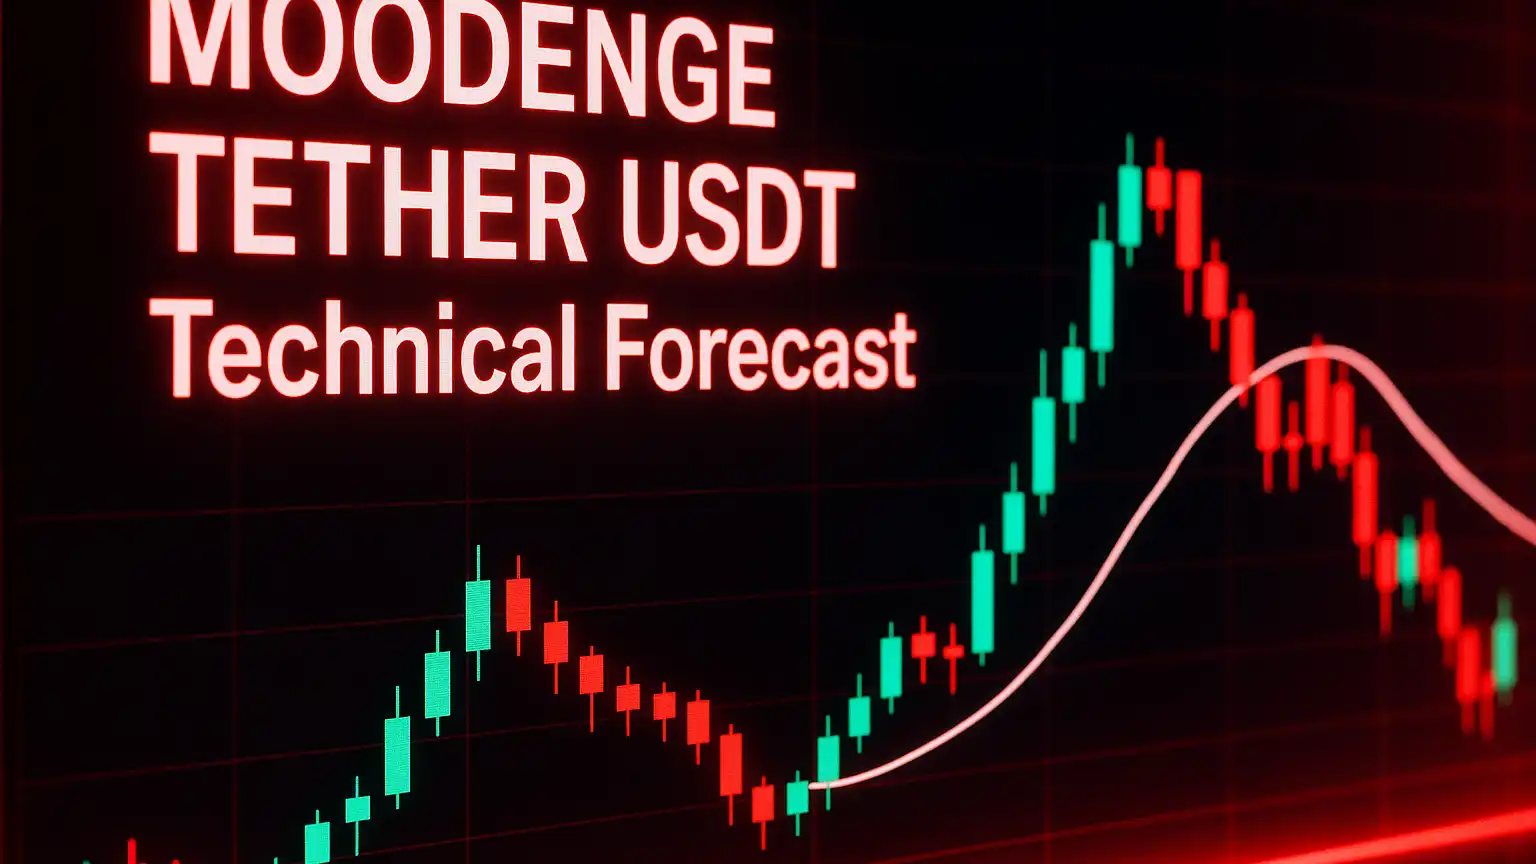
Technical Indicators & Price Action Analysis
Right now, MOODENG is sitting at roughly $0.06810, down about 0.42% in the last 24 hours. If you look at the daily charts on major exchanges like XT.COM, the technical picture is somewhere between mixed and bearish. Most moving averages—whether you’re looking at 5-day or 200-day—are flashing sell signals pretty strongly. The technical indicators tell a slightly more nuanced story, though. There’s a hint that we might see a short-term bounce, but there’s some serious resistance overhead. MACD is pretty neutral to slightly bearish, and RSI is hanging around the middle, which means we’re not seeing strong conviction from either buyers or sellers right now. The ATR indicator shows us that volatility is still running high, with big percentage swings happening relative to the current price.
Support, Resistance, and Trend Zones
The support levels worth watching are clustered between $0.066 and $0.074, though there’s a weaker floor around $0.060 that could give way under pressure. On the upside, resistance starts showing up around $0.075–$0.082, with even stronger barriers above $0.090 if MOODENG can mount a real comeback. Looking at different timeframes, the price is trading below its mid- and long-term moving averages—the 50-, 100-, and 200-day EMAs and SMAs—which typically indicates we’re in either a bearish phase or a consolidation period. The Bollinger Bands are telling us that price is bumping up against the upper bounds in some timeframes, which could mean the upside is getting stretched and a pullback might be around the corner.
Price Prediction Scenarios
Looking at the current technical setup, here’s how MOODENG might play out over the coming weeks and months:
- Base Case (Consolidation & Sideways Drift): Most likely, MOODENG will bounce around between $0.066 and $0.075, struggling to break through that $0.082 resistance level. In this scenario, expect plenty of small ups and downs driven by social media chatter or minor exchange announcements. You’ll see volume spikes here and there, but no clear directional breakout either way.
- Bullish Breakout: If something big happens—think a listing on a major exchange, an unexpected partnership, or a fresh wave of media attention—MOODENG could punch through that $0.082 resistance and aim for $0.090 to $0.100 over the next several weeks. You’d want to see MACD flip positive and RSI climb above 60 or so to feel confident about this scenario playing out.
- Bearish Decline: On the flip side, if no new catalysts emerge, MOODENG could slip below current support levels into the $0.060–$0.065 range. If it breaks decisively below $0.060, we could see it slide toward $0.050 or even lower, especially if broader market conditions turn sour or regulatory concerns pop up again.
Risk Factors & Key Watchpoints for Traders
Let’s be real—MOODENG carries some serious risk. It’s heavily dependent on hype cycles and exchange listings, which means sentiment can shift on a dime and trigger sharp reversals. Regulators are starting to take notice of memecoins, and since MOODENG doesn’t have much in the way of actual utility, it’s pretty vulnerable to policy changes. From a technical standpoint, keep your eyes on MACD divergence and falling ADX readings—these often signal that a trend is running out of steam. Volume is another critical factor to monitor: legitimate breakouts need volume behind them. If you see price moving up on weak volume, it’s usually a sign that a pullback is coming.
Emerging Insight
When you step back and look at MOODENG across different timeframes, it’s sitting at a pretty critical crossroads. It’s not clearly bearish, but it’s not in a solid uptrend either—and that kind of uncertainty tends to favor traders who can move quickly and adapt. The weight of the evidence suggests MOODENG will probably stay range-bound in the near term, with occasional sharp moves tied to news events or social media buzz. If it can break above resistance, there’s potential upside toward $0.090-$0.100. But if support crumbles, we could see losses down to $0.050. Either way, the ride is going to be bumpy rather than smooth. If you’re thinking about getting involved, make sure you have tight risk controls in place and don’t put too much capital on the line in this uncertain environment.