
Recent Developments & Market Context
Momentum (MMT) has quickly made a name for itself in the Move/Sui DeFi space since launching its beta on March 31, 2025. The project now holds over $600 million in total value locked (TVL), has processed $26 billion in cumulative trading volume, and has roughly 204 million MMT tokens circulating. These numbers point to solid early traction and user interest.
The platform brings some interesting features to the table, including a ve(3,3) governance model, concentrated liquidity market maker (CLMM) architecture, and an active buyback program running since November 2025. This buyback mechanism takes protocol revenue and uses it to purchase MMT tokens, which are then distributed to veMMT holders while reducing the overall supply in circulation. It’s designed to create alignment between the protocol and long-term token holders.
That said, the market sentiment has been a bit of a rollercoaster. While MMT enjoyed some impressive rallies thanks to exchange listings and backing from major players like Coinbase and Circle, it’s also seen some steep pullbacks. One major concern going forward is the token unlock schedule—a significant chunk of MMT is still locked up and set to be released throughout 2026, which could put pressure on the price if demand doesn’t keep pace.
Technical Indicators: Current State & Short-Term Bias
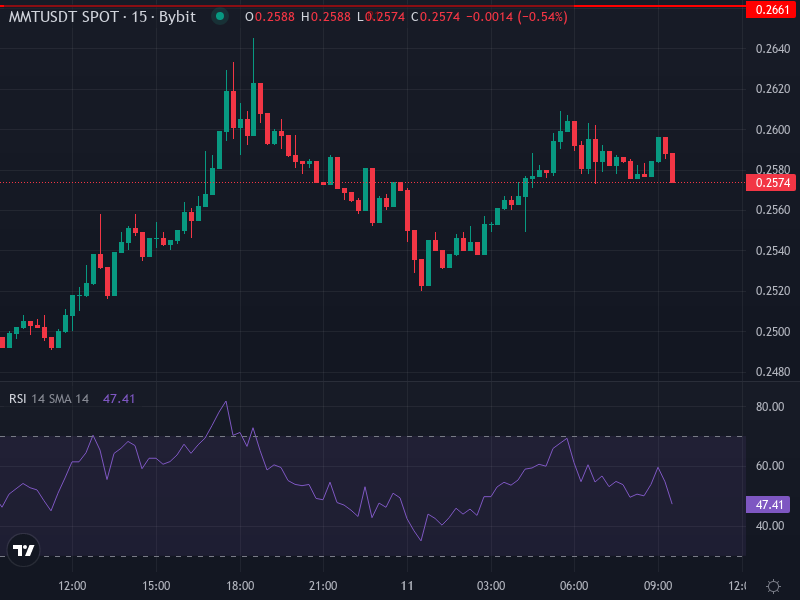
Right now, MMT/USDT is trading around $0.2572, up about 3.15% in the last 24 hours. Looking at the 4-hour chart, the Relative Strength Index (RSI) sits at roughly 59.46—pretty neutral territory, leaning slightly toward overbought but nothing too concerning yet.
The 4-hour MACD shows the MACD line sitting just above the signal line, with a small positive histogram reading around 0.00035. This suggests some bullish momentum is building, though it’s fairly gentle at this stage. We’d need to see trading volume pick up to really confirm any sustained move higher.
Both the 4-hour Simple Moving Average (SMA) and Exponential Moving Average (EMA) are hovering around $0.25124 and $0.25107 respectively. The fact that price is holding above these moving averages is a good sign for the short term. However, if we see a drop below these levels, it could trigger a quick retest of lower support zones.
Support & Resistance Zones / Daily Pivot Levels
Looking at daily pivot points, the key resistance levels to watch are around $0.2661 (R1), $0.2748 (R2), and $0.2853 (R3). On the downside, support comes in near $0.2469 (S1), $0.2364 (S2), and $0.2277 (S3). The daily pivot sits at approximately $0.2556. These levels give traders some clear zones to watch for potential entries and exits in the short term.
Mid-Term Price Projections & Scenarios
When we look at the bigger picture for the next 6 to 12 months, things get a bit trickier to predict. Based on various forecasting models that factor in historical volatility, adoption trends, and broader crypto market cycles, MMT could realistically trade anywhere between $0.1774 and $0.7062 through 2026 according to CoinCodex. That upper range would require continued protocol growth, favorable regulations, and expanded use cases in real-world assets and cross-chain liquidity.
If the current support around $0.25 holds and we see increased buyback activity along with more veMMT participation, there’s a decent chance we could see a push toward that first resistance at $0.266, possibly extending to $0.275 or even $0.285. On the other hand, if those token unlocks create selling pressure, or if volume doesn’t support the upward moves, we could easily see a pullback to $0.247 or lower, potentially testing $0.236. A break below those supports would definitely shift the mood more bearish.
High-Impact Catalysts to Watch
1. **Protocol Revenue & Buyback Velocity** — The more aggressive and frequent the buybacks, the better for reducing circulating supply and supporting price. This will be worth tracking closely.
2. **Token Unlock Schedule** — Those big vesting events coming in 2026 are probably the biggest wild card. If there’s not enough demand from staking, utility, or veMMT locking to absorb that new supply, we could see significant volatility and downward pressure.
3. **Regulatory Developments & Institutional Adoption** — Progress on the regulatory front, like the Momentum X compliance infrastructure, or clearer crypto regulations globally could bring in institutional money. That type of capital tends to be stickier and could provide more stable support for the price.
Summary Forecast
All things considered, Momentum looks positioned for modest gains in the short term, with technicals favoring a move toward those daily resistance levels between $0.266 and $0.285—assuming volume picks up and the overall market cooperates. Looking further out over the next 6 to 12 months, the story really depends on how well supply is managed through buybacks and how those vesting schedules play out. In a best-case scenario with everything clicking, we could see a push toward $0.70, but that’s a lot of “ifs.” In a less favorable environment, especially if demand weakens, we could easily slide back to the $0.24 to $0.20 range.
The $0.25 support level is really the line in the sand to watch. Holding above it keeps the bullish case intact; dropping below it could open the door to deeper corrections.