
Recent Developments Shaping MET’s Trajectory
Meteora has found itself caught in a storm of legal troubles and community backlash after facing serious fraud allegations. The main accusations revolve around pump-and-dump operations tied to several memecoins—namely “$M3M3”, “$LIBRA”, “$MELANIA”, “$ENRON”, and “$TRUST”—where investors claim Meteora and related parties deliberately manipulated both public sentiment and liquidity pools. The allegations paint a picture of tokens being hyped up with celebrity endorsements only to crash hard soon after, leaving everyday investors holding the bag. Class action lawsuits have been filed across multiple jurisdictions, naming both Meteora and its founders as defendants.
Meanwhile, on the tokenomics side, MET has been running a pretty aggressive supply management playbook. They dropped a massive airdrop that distributed roughly 48% of total supply, which predictably led to quick sell-offs from major recipients—including some folks tied to previous Meteora memecoin launches. To counter the selling pressure, Meteora rolled out a $10M buyback program in Q4 2025, committing about 88% of their revenue to absorb tokens from those unlocks. They’ve also launched the Comet Points rewards program to try and keep holders and liquidity providers engaged and sticking around.
Technical Indicators & Price Action Analysis
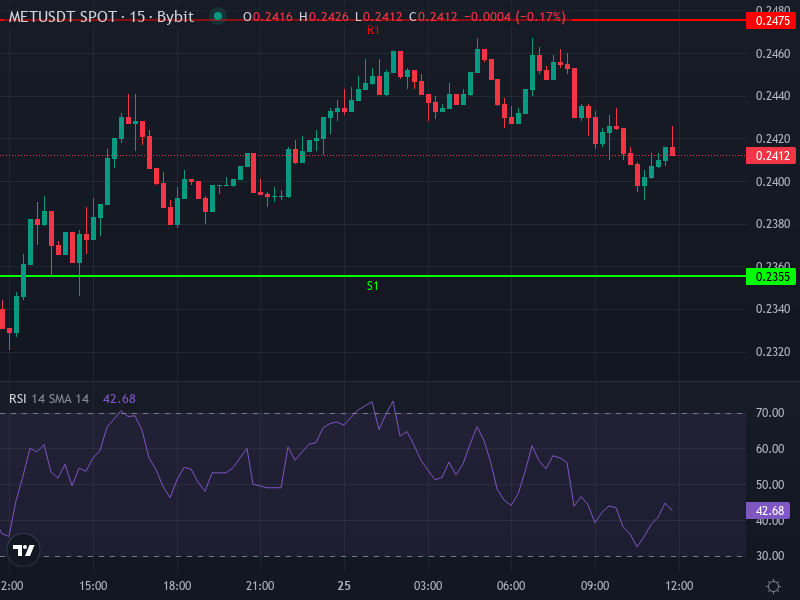
Right now, MET is trading around $0.2413, up about 3.24% over the last 24 hours. Looking at shorter timeframes, the indicators are showing moderate strength without any real conviction. The 4-hour RSI is sitting near 57—right in the middle ground, not overbought or oversold—which tells us traders are being cautious rather than aggressive. The 4-hour MACD is barely positive with a small histogram bar, hinting at slight upward momentum but nothing that screams breakout just yet.
The 4-hour Simple Moving Average is around $0.2385, with the Exponential Moving Average almost identical at $0.2386—both sitting just below the current price. That suggests we’ve got some recent price strength and potential support forming in that $0.238–$0.240 zone. When we zoom out to the daily timeframe, pivot levels tell an interesting story: resistance levels stretch from $0.2475 to $0.2595, while support runs down toward $0.2279 to $0.2235.
Projection Scenarios & Key Levels to Monitor
In the short term, MET looks like it’s consolidating just above that $0.238–$0.240 support zone. If we can break above the first daily resistance at $0.2475, we could see a push toward the second level near $0.2519, and with enough momentum behind it, $0.2595 becomes a realistic swing target. That said, there’s likely overhead resistance from those airdrop recipients who might still be looking to exit, so volume will be critical to watch as we approach each resistance level.
On the flip side, if price slips below $0.2385 with a weakening RSI or a bearish MACD crossover, we’re probably headed down to test support at $0.2355, and potentially deeper into that $0.228–$0.224 zone. These levels line up with historical demand areas and places where liquidity providers and long-term holders have stepped in before.
Possible Catalysts & Risk Factors
**What could push MET higher:** The ongoing buyback program could actually make a dent in selling pressure; strong participation in the Comet Points program; growth in revenue or fresh partnerships within the Solana ecosystem; and any positive movement on the legal front—whether dismissals or clear regulatory guidelines.
**What could drag it down:** The legal mess continues to hang over everything and could get worse with penalties or settlements; more token unlocks hitting the market and getting dumped by large holders; lasting damage to trust and reputation from the MELANIA and LIBRA controversies; and broader market weakness, especially if Solana or the DeFi sector takes a hit.
If MET keeps trading in its current pattern—not breaking resistance but not falling through support either—we’re most likely looking at range-bound action between $0.23 and $0.26 over the next few weeks. But if either boundary gives way decisively, we could see acceleration toward either a roughly 50% drop or a 30% rally, depending on which side breaks first.
Technical Price Prediction
Taking everything into account—the indicators, supply dynamics, and recent price action—here’s what seems realistic over the next 2-4 weeks: In a bullish scenario with strong volume, positive developments, and maybe some legal wins, MET could reach **$0.30 to $0.32**. Under a more neutral, base-case scenario with mixed signals and sideways action, we’re probably looking at **$0.24 to $0.27**. And in a bearish scenario with bad legal news, more selling pressure, or weak market conditions, we could see a test of support down around **$0.20 to $0.22**.