
Current Market Conditions and Recent Drivers
Right now, MEME/USDT is sitting at around 0.00122258, which marks a roughly 2.85% drop in the last 24 hours. The slide seems to come down to weak buying interest paired with general hesitation around risky, speculative coins. There haven’t been any big announcements coming out of the MEME camp lately—things have been pretty quiet on the news front—which tells us that traders are mostly watching chart levels and overall sentiment instead of waiting for any fundamental catalysts or major developments.
From a regulatory angle, memecoins as a whole have caught the eye of policymakers. Over in the U.S., the SEC has started classifying some memecoins as “collectibles” instead of securities, which actually strips away certain investor protections. This approach seems to be cooling off institutional players, putting more weight on retail traders whose enthusiasm can be strong but also fickle. With social buzz being one of the few things pushing these coins forward, any real upside momentum will likely depend on community hype or something going viral, rather than partnership deals or technology improvements.
Technical Indicators & Key Price Levels
Taking a closer look at the four-hour charts:
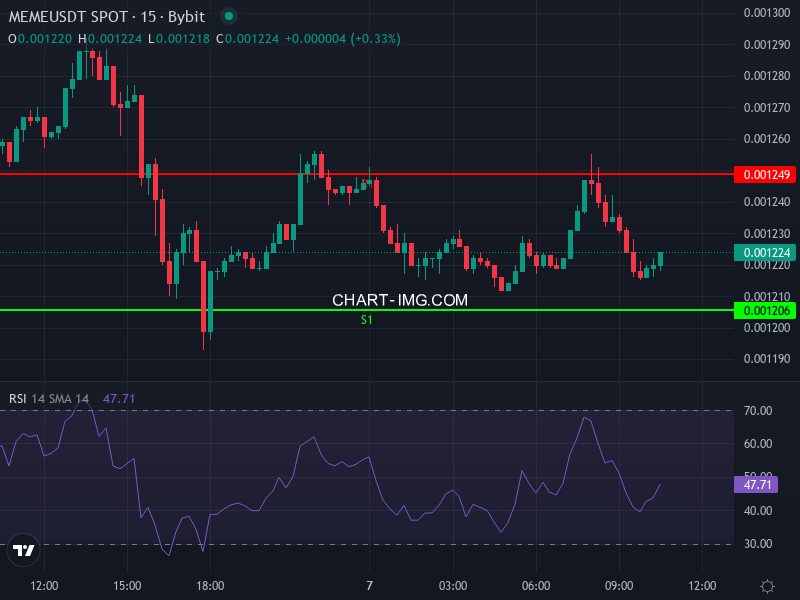
– The RSI is hovering around 53.6—slightly on the bullish side, but really too neutral to suggest any strong move is brewing. For a meaningful rally, we’d need to see the RSI climb above 60 with solid volume backing it up. (RSI ≈ 53.62)
– The MACD is showing a bit of bearish divergence: the MACD line is sitting below the signal line with a small negative histogram reading. This hints that recent pushes higher are running out of gas. (MACD ≈ 0.00002778, Signal ≈ 0.00003622, Hist ≈ –0.00000844)
– The 4-hour Simple Moving Average sits at about 0.00120637, while the Exponential Moving Average is around 0.00119586. Since the current price is above both—though not by much—there’s some support just underneath, but resistance isn’t far off either. If price dips toward that 0.00120 zone where the SMA and EMA cluster, we might see buyers step in.
Daily Pivot Zones
Looking at daily pivot points, here’s what we’re working with:
– Pivot (P): roughly 0.00123033 — basically right where price is now, acting as the first layer of resistance.
– Resistance levels: R1 sits around 0.00124867; R2 near 0.00127333; R3 at 0.00129167 — these are your upside targets if the bulls manage to gain some traction in the short term.
– Support zones: S1 is at about 0.00120567; S2 around 0.00118733; S3 down at 0.00116267 — breaking below S1 could open the door to more downside toward S2 and S3. Given the weak MACD signals, holding above S1 is pretty important if we want to keep any bullish outlook alive.
Price Prediction Scenarios and Outlook
Based on what the indicators and market sentiment are telling us, here are two realistic scenarios for the next week or two:
– Bull Case: If MEME can hold above that 0.0012057 support level (daily S1) while volume picks up and RSI pushes past 60, there’s a decent shot at testing R1 around 0.0012487. Breaking through there could open up moves toward R2 (roughly 0.0012733) or even R3 (about 0.0012917), though expect sellers to show up more aggressively near the 0.00130 mark.
– Bear Case: If MEME drops below 0.0012057, the next meaningful floor is S2 at around 0.0011873. If that level gives way too, we could see further weakness down toward S3 near 0.0011627. With volume and sentiment both looking soft, price might drift back toward the EMA/SMA area (somewhere between 0.001195 and 0.001206), which could set off a sharper selloff.
All things considered, the neutral vibe, tight trading range around the pivot, and the indecisive MACD suggest price will probably stay stuck in this range for now—unless some big external catalyst shows up, like a viral moment in the community, a new exchange listing, or surprise news. Until something shakes things up, keep a close eye on volume activity around the pivot (0.0012303) and S1 (0.0012057) to get a better sense of which way momentum might tip.