## Recent Developments & Fundamental Context
LRC has faced significant headwinds lately, largely stemming from some tough strategic decisions that have narrowed its utility scope. In a move that caught many off guard, Loopring officially shut down several key DeFi products back in July 2025—including Dual Investment, Portal, and ETH staking services. While the core Layer-2 zk-rollup infrastructure is still running smoothly, this consolidation has left some users wondering about the project’s broader vision. The team seems to be doubling down on protocol scalability, but there’s no denying this pivot has trimmed away features that once attracted active users.
Making matters worse, major exchanges have been backing away from LRC. Binance pulled the plug on margin trading for LRC at the end of January 2026, and Coinbase dropped several non-USD trading pairs last December. These changes limit how traders can engage with the token, which naturally dampens speculative interest and liquidity.
That said, it’s not all doom and gloom. Loopring’s underlying technology still holds water. The zk-rollup infrastructure delivers genuinely low gas fees, fast withdrawals, and has expanded to networks like Base. Plus, the team has been quietly polishing the mobile interface, making the user experience noticeably smoother. If they can attract more developers and everyday users, there’s still potential here—it just depends on execution.
## Technical Analysis: Indicators & Price Action
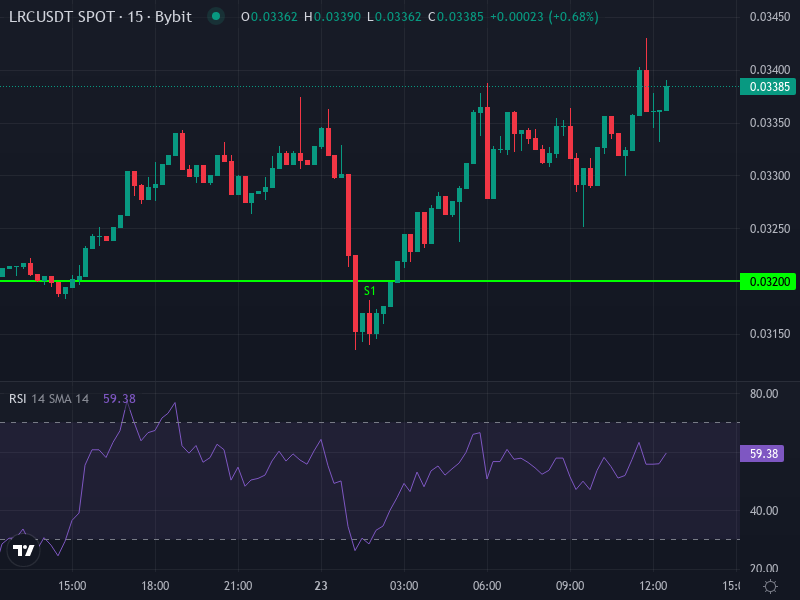
Right now, LRC/USDT is trading around **$0.03377**, up about 5.36% over the last 24 hours. The technical picture is kind of mixed—showing some short-term bullish hints, but with clear resistance overhead and real risk if support cracks. Here’s what the charts are telling us:
– The four-hour RSI sits at roughly 55.99, which suggests mild bullish momentum without being stretched into overbought territory. There’s still room to move higher if buying pressure picks up.
– The four-hour MACD recently crossed above its signal line, creating a positive histogram. That’s usually a sign momentum is shifting in favor of bulls, at least on this shorter timeframe.
– Both the 4-hour simple moving average (around $0.03296) and exponential moving average (near $0.03331) are sitting below the current price, which lends some credibility to the bullish structure in the near term.
– Daily pivot levels paint a clearer picture of the battlefield: resistance starts around $0.0352 at R1, with tougher walls at R2 near $0.0365 and R3 around $0.0384. On the flip side, support comes in at S1 around $0.0320, S2 near $0.0301, and a firmer floor at S3 around $0.0288. The daily pivot point itself is hovering at $0.0333.
– The daily rate-of-change indicator shows roughly –2.59%, hinting that recent momentum has actually leaned bearish despite today’s uptick.
## Price Projection: Scenarios & Targets
The technicals point to a few different possible paths depending on whether the bullish signals can stick around or if the pressure intensifies. These scenarios are most relevant for traders looking at days to a few weeks ahead. Anything longer-term really hinges on fundamentals—things like developer adoption, network activity, and where the broader crypto market is headed.
### Bullish Scenario
If LRC manages to hold support around $0.0320 and closes daily candles above that pivot near $0.0333 with decent volume backing it, we could see a push toward resistance levels. First target would be R1 at $0.0352—nothing too dramatic, but a reasonable move. If momentum carries through, R2 around $0.0365 comes into play. Breaking cleanly above $0.0384 would be more significant and could open the door toward the $0.040-$0.042 zone. But let’s be real—each of these steps needs increasing volume and some help from broader market sentiment, especially considering those recent exchange delistings weighing on confidence.
### Bearish Scenario
On the downside, if price can’t stay above $0.0320—especially if it slips below both the SMA and EMA—the short-term bullish structure falls apart pretty quickly. In that case, S1 at $0.0320 likely won’t hold for long, opening up S2 around $0.0301. If the selling continues, there’s genuine risk of sliding down to S3 near $0.0288, particularly if the overall crypto market stays shaky. Any additional bad news—like more exchange restrictions or a broader market selloff—could accelerate the downside even faster.
## Projected Price Ranges & Key Timing
Looking at everything together—the indicators, recent price action, and the news flow—the most realistic trading range for LRC over the next one to three weeks is probably somewhere between **$0.0325 and $0.0365**, assuming neither major support nor resistance gets decisively broken. A breakout above $0.038 could theoretically push toward $0.042, but that feels like a stretch without some real positive catalyst coming into play.
Zooming out to a monthly view, modest gains seem possible if the current momentum holds—maybe a climb toward $0.040, though that’s contingent on seeing some fundamental improvements or renewed interest. On the other hand, if bearish pressure takes over, revisiting $0.030 or even lower is definitely on the table.