Recent Developments & Fundamental Drivers
Lagrange has been turning heads in the crypto space lately, trading under the ticker $LA. What makes it interesting is its focus on zero-knowledge infrastructure combined with AI verification tech. The team has built two main products — a ZK Prover Network and a ZK Coprocessor — designed to handle proof systems for rollups and those computationally intense smart contract operations that usually bog things down.
What really caught people’s attention was when they integrated their DeepProve zkML with Intel’s AI Cloud and Oracle Cloud Infrastructure. That’s a pretty big deal because it shows they’re serious about going after enterprise clients, not just staying in the retail crypto sandbox. These moves have definitely helped LA’s reputation as a project with real utility potential.
But it’s not all sunshine and rainbows. There’s some genuine concern around how the tokens are structured. Word got out that roughly 40 million LA tokens hit exchanges around mid-2025, which naturally got people worried about a wave of selling. Add to that an estimated 4% annual inflation rate with no hard cap, and you’ve got a recipe for dilution unless demand from staking and actual network usage picks up the slack.
LA has managed to land listings on all the big players — Coinbase, Binance, Bitso, you name it. That’s brought in more eyeballs and trading volume, which is great. The problem is, those post-listing pumps didn’t stick. Seems like the actual buyer demand hasn’t kept pace with the hype around new exchange listings, leaving LA bouncing around more than anyone would like.
Technical Indicators & Price Action
Right now, LA is sitting at around $0.33836, which is down roughly 6.19% in the last day. The charts aren’t exactly screaming bullish at the moment unless we see those support levels hold firm. Price is trading well under both the simple and exponential moving averages on the 4-hour chart (hovering around $0.360), which tells us short-term momentum is leaning bearish.
Looking at the MACD on the 4-hour timeframe, we’re in negative territory with the MACD line at -0.00941 and the signal line at -0.00765. The histogram is ticking down slightly, which basically means the downward momentum hasn’t run out of steam yet.
The RSI is sitting near 33 on the 4-hour chart. That’s getting close to oversold levels but isn’t quite there yet, so there’s potentially more room to drop before buyers might step in thinking they’re getting a bargain. The daily pivot analysis shows some important levels to watch: support is stacking up between $0.3273 (S1) and $0.3163 (S2), while resistance camps out at $0.3524 (R1) and $0.3665 (R2). These numbers matter because traders are definitely watching them to figure out whether we’re about to bounce or break down further.
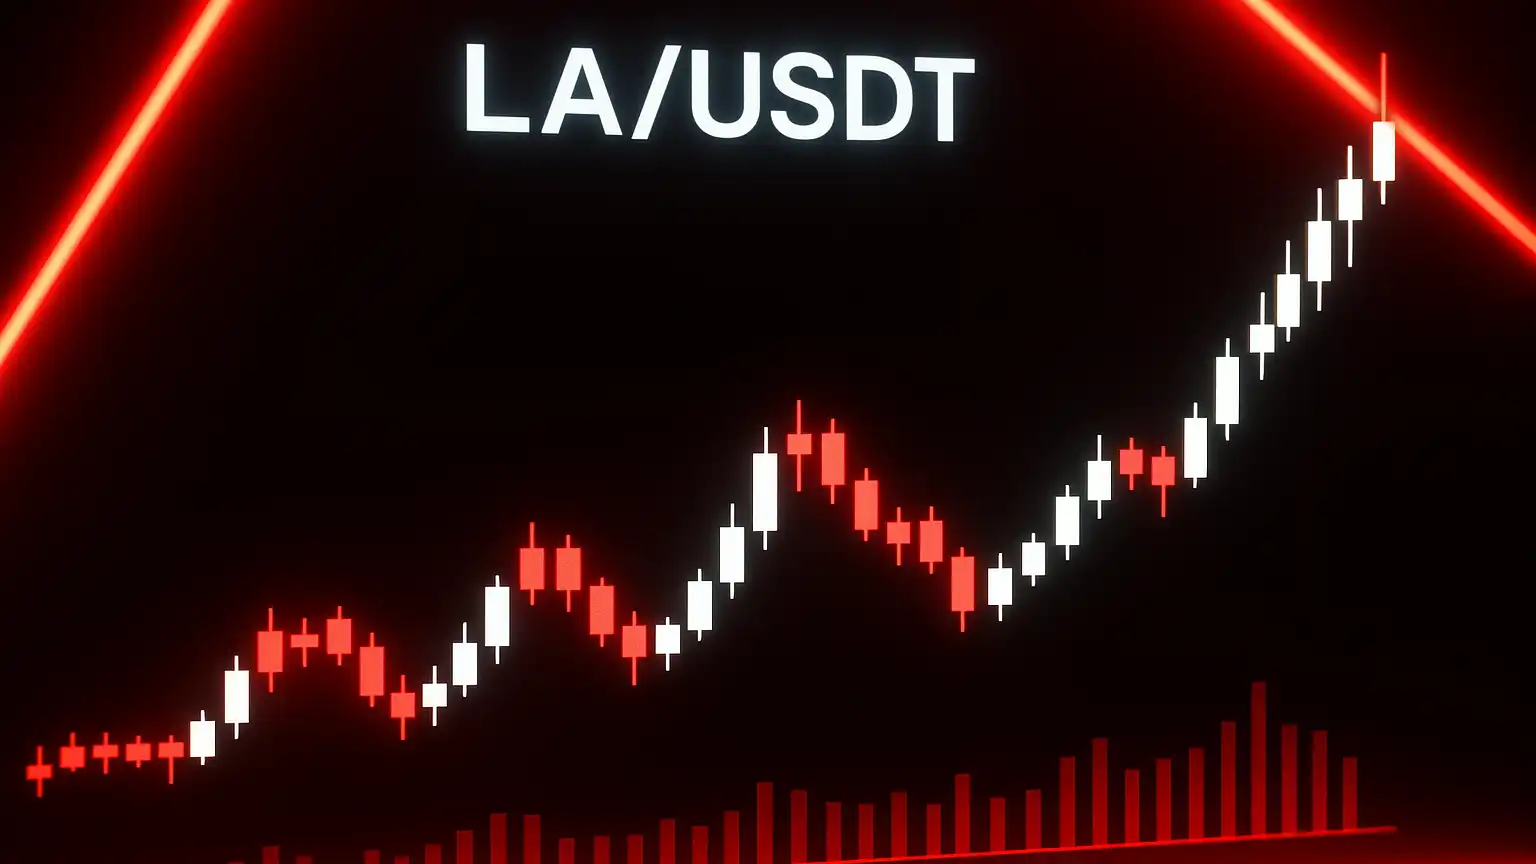
Here’s what the recent price action looks like:
Price Predictions Based on Scenarios
Bearish Case
If LA punches through that $0.3273 support level, things could get uncomfortable pretty quickly. Next stop would likely be around $0.3163, possibly even down to $0.3022. Drop below the $0.30 psychological level and you’re probably looking at a bunch of stop losses getting triggered, which could snowball into a move toward $0.28 or even lower. In this kind of scenario, you’d expect the MACD to roll over harder, moving averages to point steeper downward, and RSI potentially diving into the 20s — all of which would freak people out. Throw in those tokens flowing onto exchanges and the inflation issue, and you’ve got a perfect storm for more selling.
Bullish Case
Now, if buyers decide to show up and defend current levels, we could see a bounce back toward that $0.3524 mark. Push through that and hold $0.3665, maybe even test $0.3775, and suddenly the mood shifts. Bulls would be back in control. For this to actually happen though, we’d need to see real proof demand picking up, more enterprise adoption coming through the pipeline, or maybe some positive news like a token buyback program or staking rewards going live. Any combination of those could flip sentiment pretty fast. If we’re looking further out and the stars align, LA could realistically trade somewhere in the $0.50–$0.60 range by the second quarter of 2026. That’s assuming the team keeps delivering on their roadmap and actual network usage grows enough to offset those inflation pressures we talked about earlier.
Trading Strategy & Key Levels
If you’re actively trading LA or holding a position, here’s what makes sense to keep an eye on:
– Set yourself an alert somewhere between $0.327 and $0.334 — this range is basically the battleground right now that’ll determine whether we’re heading lower or bouncing back up.
– Keep tabs on the MACD and RSI across different timeframes. If you see the MACD cross back above its signal line and RSI climb past 50, that’s your hint that momentum might be shifting bullish.
– Watch those exchange flows like a hawk. When large amounts of tokens start moving onto exchanges, it usually means someone’s planning to sell, which isn’t great for price.
– Don’t forget about that inflation issue. Once staking or delegation features are fully up and running, they might offer some yield that makes holding more attractive and takes some of that supply pressure off the market.
When things are this choppy, it’s smart to keep position sizes smaller or scale into entries near those support levels. If support gives way, drawdowns can get steep in a hurry, so don’t get caught overextended.