Recent Developments & Ecosystem Context
Lagrange (LA) is a project that’s all about zero-knowledge proof generation, and they’ve recently rolled out their native utility token. This token is meant to fuel their Prover Network, ZK Coprocessor, and DeepProve zkML library. The team has set up a total supply of 1 billion LA tokens, with roughly 4% annual emissions going toward proof-prover rewards, staking incentives, and network subsidies. To keep things from getting out of hand with supply flooding the market, early contributors and ecosystem participants are facing cliff periods and linear unlock schedules. The whole setup is designed to tie proof demand directly to token demand, which should give the token some real underlying value.
When it comes to market action, LA had an absolutely wild launch. Right after the token generation event and listings on major exchanges like BingX and Coinbase, the price exploded—we’re talking over 500% gains. But as you’d expect, what goes up fast often comes down just as quickly. Following those initial spikes, we’ve seen consolidation phases and some pretty sharp pullbacks. Those corrections have largely been driven by unlocked supply hitting the market and early investors taking profits. The volatility here is clearly being driven more by external catalysts and speculation than by actual network usage at this point.
Current Technical Setup & Indicators
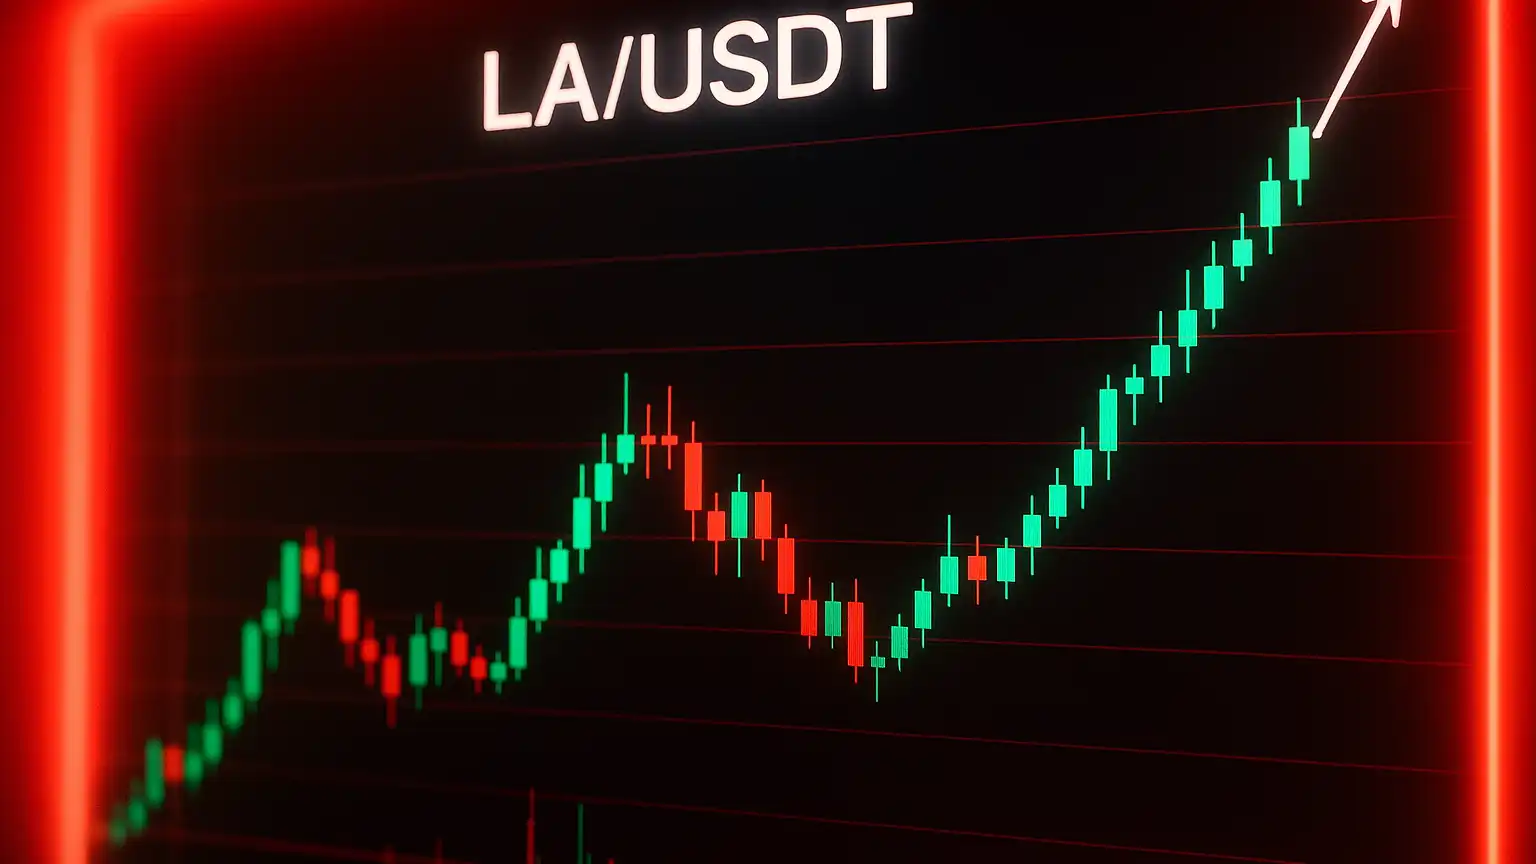
Right now, LA/USDT is trading around $0.21414, down about 3.28% in the last 24 hours. If we look at the 4-hour chart, the key moving averages tell a pretty clear story: the SMA is sitting at roughly $0.23262 and the EMA is lower at about $0.22616. The fact that price is trading well below both of these is a bearish signal—it shows that short-term momentum is pretty weak.
The 4-hour Relative Strength Index (RSI) is hovering around 37.3. That’s below the neutral 50 mark but hasn’t quite hit oversold territory (below 30). So we’re seeing downward pressure for sure, but there’s still room for things to stabilize if sellers ease up a bit. The MACD isn’t looking much better—the MACD line has dropped below its Signal line, and the histogram is in negative territory. That’s confirmation that bearish momentum is building.
Looking at daily pivot points, we’ve got some important levels to watch. Resistance is stacked between $0.2234 and $0.2381 (R1 through R3), while support levels are down in the $0.2087 to $0.1940 range (S1 through S3). The daily pivot point sits at about $0.2182, which means the current price is just slightly below that level. If the bearish pressure keeps up, we could easily drift down toward S1.
Price Prediction Scenarios
Bullish Case
For the bulls to take control, LA needs to reclaim that $0.226 to $0.232 zone where the EMA and SMA are currently sitting. If that happens and we see a break above $0.238, there’s a good shot at pushing toward the $0.250 to $0.270 range. This would especially be the case if we get any positive news—think partnership announcements, actual live projects using the ZK coprocessor, or tighter controls on token emissions. Watch for the RSI to climb back above 50 and for a bullish MACD crossover to confirm the shift in momentum. If you’re thinking about going long, it makes sense to set stops just below that daily pivot at $0.218 to protect yourself from downside risk.
Bearish Case
On the other hand, if LA can’t punch through that EMA/SMA resistance zone, we’re probably headed lower. The first support to test would be $0.2087. If that breaks, we’re looking at $0.2035 next (S2), and potentially down to $0.1940 (S3) if things really get ugly. A sustained break below these levels would likely trigger more weakness, especially if we see sell volume spike or if there’s broader risk-off sentiment hitting the crypto markets. Keep an eye on the RSI—if it trends toward 30—and watch for the MACD divergence to grow more negative, as those would signal that bearish pressure is intensifying.
Strategic Implications for Traders & Investors
Let’s be real—this is a high-volatility play. With price below both the EMA and SMA, a bearish MACD, and a weak RSI, the short-term outlook favors downside movement. For active traders, this might be an opportunity for short-term short positions, or if you’re looking to go long, you’ll want to be defensive with tight stop losses. For longer-term investors, the real question is whether Lagrange’s ZK infrastructure can gain meaningful adoption. Can they deliver live proofs at scale? Will other chains integrate with them? Does the token have utility beyond just speculation? Those are the questions that will determine long-term value.
The tokenomics here present some challenges. You’ve got 4% annual inflation, large unlock schedules on the horizon, and fairly weak price action following the initial exchange listing hype. For the price to move meaningfully higher, we’re going to need to see concrete utility—actual network usage, protocol rewards creating real demand, or staking mechanisms that effectively reduce circulating supply. The team has built in staking and delegation to lock up tokens over time, but that needs to outpace both the inflation rate and those unlock schedules to have a positive price impact.
Projected Targets & Risk Points
If we do get a bullish move, here are the upside target zones to watch:
– $0.238 to $0.250 as the first resistance cluster.
– $0.270 to $0.300 if momentum really picks up and buying demand increases significantly.
On the downside, these are the critical risk zones you need to monitor:
– $0.2087 (daily S1)—this is immediate support that really needs to hold.
– $0.1939 to $0.1940 (S3)—this is the key line in the sand. Breaking below this level could trigger a much deeper correction.
Final Insight
Lagrange is currently going through a consolidation and correction phase after that initial volatility explosion. The technical indicators are leaning bearish to neutral in the short term, though there’s definitely potential for recovery if we can break through those resistance zones. For anyone thinking long-term bullish, the token’s value proposition really depends on actual network usage and proof generation demand picking up significantly. For traders, focus on whether we bounce off resistance or break down through support, and make sure you’ve got solid risk management in place given how tight the price structure is and how volatile this thing has been.