Current Context & Market Sentiment
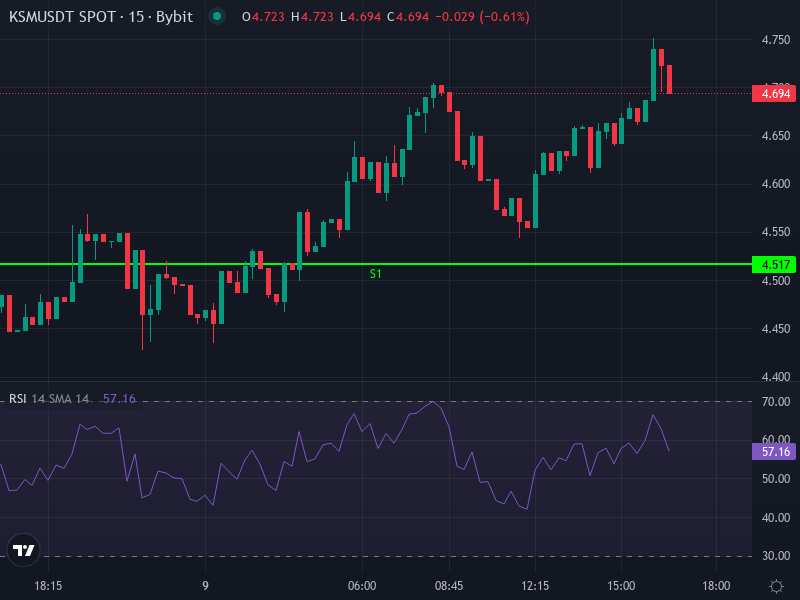
Right now, Kusama (KSM/USDT) is trading around $4.70, showing a nice bump of roughly +5.38% over the past 24 hours. We’ve been watching it consolidate between $4.50 and $5.20 for a while, with resistance holding firm in that upper range. The good news? Bearish pressure seems to be easing up across multiple indicators and moving averages. When you zoom out to the daily charts, things look a bit messy—some signals are still pointing down, while shorter timeframes are starting to show what could be breakout attempts. Tools like the MACD and RSI on those longer timeframes are hinting that we might be transitioning from negative momentum into something more neutral, or even bullish.
Technical Indicators & Price Levels: 4-Hour Frame
Looking at the 4-hour chart gives us a clearer picture for what might happen in the short term. Here’s what stands out:
- Relative Strength Index (RSI): Sitting at around 58.76 right now, which tells us buyers are getting more active without things being overheated yet. There’s room for this upward momentum to continue before we’d worry about overbought conditions.
- MACD: We’ve got a bullish crossover happening here, with the MACD line crossing above its signal line and a positive histogram reading of about 0.0386. This typically signals that bullish momentum is starting to build after we’ve been in negative territory. If this holds and volume backs it up, we could see more upside.
- Moving Averages: The 4-hour Simple Moving Average is around $4.5743, with the Exponential Moving Average at $4.5835. Since KSM is currently trading above both at roughly $4.70, that’s giving us a short-term bullish signal. If we see any pullbacks, these levels should provide some support.
- Pivot Points (Daily): For resistance, we’re looking at $4.82 (R1), $4.93 (R2), and $5.12 (R3). On the support side, there’s $4.52 (S1), $4.33 (S2), and $4.22 (S3). The main pivot sits at $4.63—this is basically where the battle between bulls and bears plays out.
Forecast Scenarios & Price Projections
Over the next few days to a week, Kusama will likely take one of two main paths. Everything hinges on whether buyers can push through that resistance around $4.82 to $5.12, or if they run out of steam and trigger a deeper pullback.
Bullish Scenario
If the current momentum keeps up—with the MACD staying positive, RSI climbing toward 70, and decent volume coming in—we could see KSM challenge those resistance levels one by one. Breaking above $4.82 (R1) would be the first hurdle, opening the path to $4.93 (R2) and potentially $5.10–$5.12 (R3). Getting a solid close above $5.10 could flip the short-term trend decidedly bullish, with possible targets around $5.30 or even higher if the broader market cooperates.
Bearish Scenario
On the flip side, if KSM can’t hold above the $4.57–$4.60 zone (where those 4-hour moving averages sit), or if the MACD starts losing steam, we’re probably looking at a pullback. Dropping below $4.52 (S1) would likely send us down to $4.33 (S2), and if selling pressure really picks up, $4.22 (S3) becomes the next target. Breaking through $4.33 would suggest the bears are back in control, potentially setting us up for a test of $4.00 or lower.
Confluence & Key Triggers
Here are the key things to keep an eye on that could really move the needle:
- A daily close above the $4.82–$5.10 range with solid volume—that would signal a likely breakout.
- If price comes back to test $4.60 and can’t hold—that’s a warning sign that bullish momentum is fading.
- Watch how the MACD behaves: if that histogram keeps growing, momentum is building. But watch for any divergence from price action, as that can signal either exhaustion or continuation.
- RSI movement matters too: pushing into overbought territory after a run might mean a pullback is coming, but staying in that 50–70 range during an upward move is generally healthier.
All things considered, the short-term picture on the 4-hour chart looks cautiously optimistic for Kusama right now. There’s a decent chance we could see a push toward those resistance levels, as long as support holds. That said, if those key levels break down, there’s still meaningful downside risk to be aware of.