Recent Developments and Market Context
Over the last few weeks, Kava has been making some interesting moves. The team has pivoted toward decentralized AI infrastructure with their “DeCloud” initiative—essentially a DePIN project that aims to provide GPU resources for AI and Web3 applications. This is a pretty significant shift that takes Kava beyond its traditional DeFi roots and into the booming AI/cloud computing space. Generally speaking, moves like this tend to be positive for a token’s price because they increase real-world utility and potentially drive more demand. That said, there are some headwinds worth noting. KuCoin recently delisted KAVA from its cross-margin trading suite, which could hurt short-term liquidity and trading volume. Less liquidity often means more volatility, so that’s something to keep in mind.
Current Technical Landscape & Indicator-Based Insight
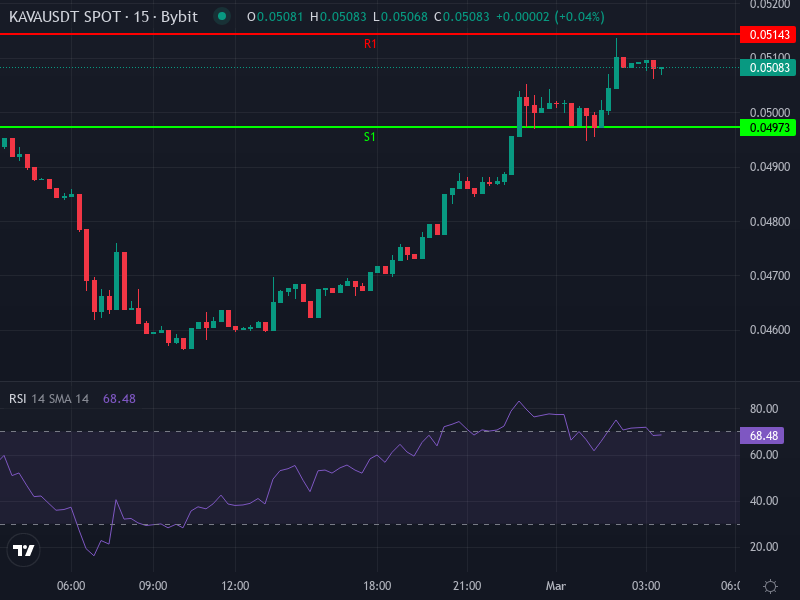
Right now, KAVA/USDT is trading around 0.05066 USDT, up about 2.25% over the past 24 hours. Looking at the 4-hour chart, the technical picture is a bit mixed but leaning slightly bullish. The RSI is sitting at around 58, which suggests decent upward momentum without being in overbought territory yet. The 4-hour SMA and EMA are both sitting below the current price (around 0.04853 and 0.04894 respectively), acting as support levels. The MACD is showing a mild positive signal with the MACD line above the signal line and a small positive histogram. All of this points to the possibility of continued recovery or at least consolidation around current levels, assuming volume holds up.
Support, Resistance, and Pivot Zones
When we look at daily pivot points, the main pivot is sitting at roughly 0.0504667 USDT. Above that, we’ve got our first resistance at 0.0514333 USDT, second resistance at 0.0521667 USDT, and third resistance way up at 0.0531333 USDT. On the downside, first support is at 0.0497333 USDT, followed by 0.0487667 USDT, and the third support level down at 0.0480333 USDT. The fact that price is hovering right around the daily pivot suggests we’re in a bit of a neutral zone—the market hasn’t really decided which way it wants to go yet.
Short-Term Price Predictions & Scenarios
Looking at how all these indicators line up with the pivot structure, here’s what could realistically happen over the next few trading sessions:
Bullish Scenario: If the MACD continues its bullish crossover and the RSI pushes up toward 65 or higher on the 4-hour chart, we could see Kava climb back above that first resistance at 0.05143. If momentum really picks up and volume comes in, there’s a decent chance we could test the second resistance around 0.05217. Breaking through to that third resistance at 0.05313 is possible too, though that’s where things might stall out—especially if buying volume starts to dry up.
Bearish Scenario: On the flip side, if Kava can’t hold above the daily pivot at 0.05047 and drops below that first support at 0.04973, we’d likely see further downside testing. The next stops would be around 0.04877 and possibly down to 0.04803. This scenario becomes more likely if the broader crypto market turns sour or if altcoins in general start to weaken.
Outlook & Key Signals to Watch
Volume is going to be absolutely critical here. If we see a breakout above resistance with strong volume backing it up, that confirms the bullish case. But if we get heavy selling volume, expect those support levels to get tested. Also worth watching for any divergence between price action and RSI or MACD on higher timeframes. If the daily MACD turns positive with a clean signal line cross and expanding histogram, that would really strengthen the bullish outlook.
Keep an eye on news flow around Kava’s DeAI infrastructure and any new partnerships they announce. Positive developments on that front could act as catalysts for price appreciation. On the other hand, regulatory issues or further exchange delistings could easily trigger selloffs.
Projection Summary
If the bulls take control, a move toward 0.053 USDT looks achievable in the short term—but that’s going to require breaking through resistance and maintaining support above the pivot. If things go the other way and support breaks down, we’re looking at potential downside toward 0.048 USDT. Given that indicators are currently mixed, my best guess is we’ll see some consolidation in the 0.050–0.052 range before the market picks a clear direction.