Recent Developments and Market Context
Huma Finance has been turning heads lately thanks to explosive transaction volume growth and some pretty impressive partnership announcements. Back in Q3 2025, the project reported processing a massive $1.7 billion in total transactions, with credit origination hitting $860.6 million. Deposits into their Huma 2.0 platform jumped by 132.3%, and staking participation saw a solid uptick too—clear signs that people are getting more engaged and confident in the platform. These numbers suggest their PayFi financial model is really starting to catch on.
Then in January 2026, Huma teamed up with Qiro to underwrite up to $250 million in real-world credit assets over the coming 12–15 months. This move is all about building institutional credibility and strengthening their risk management game.
That said, there’s a cloud on the horizon: upcoming token unlocks, including one massive release of 378 million tokens. This could flood the market with new supply and put some serious downward pressure on price in the near term.
Right now, HUMA is trading around 0.01710 USDT, up a whopping 23.39% in the last 24 hours. That kind of spike usually means something big is happening—whether it’s news-driven or just pure speculative frenzy.
Technical Indicators & Signal Summary
When we look at the charts across different timeframes, the 4-hour view shows the RSI sitting at about 70.10. That puts us in what traders call “overbought” territory. Sure, there’s strong upward momentum right now, but historically, readings this high often lead to either sideways consolidation or a quick pullback.
The MACD on the 4-hour chart tells an interesting story too: the MACD line is around 0.001234 and the signal line is at 0.000768, which gives us a positive histogram of roughly 0.000466. This confirms that bullish momentum is actually picking up speed. But here’s the thing—if price keeps climbing without the MACD keeping pace, we might see that momentum start to fade.
The moving averages back up the bullish picture: the 4-hour Simple Moving Average sits at about 0.01349 USDT, while the Exponential Moving Average is around 0.01399 USDT. Since current price is comfortably above both at roughly 0.01710 USDT, we’re clearly in an uptrend on the shorter timeframes.
Key Levels & Price Projection Based on Pivot Points
Looking at the 1-day pivot point structure gives us a roadmap:
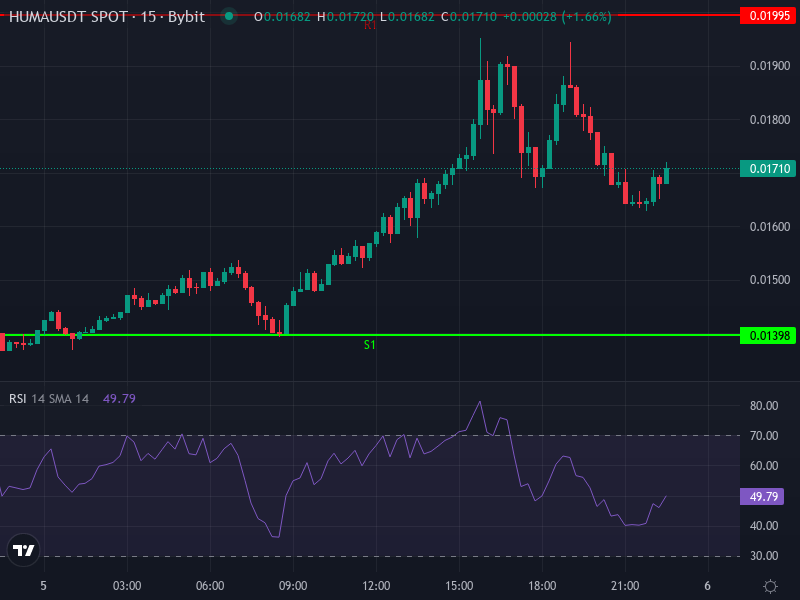
• Support levels: S1 = 0.01398 USDT, S2 = 0.01085 USDT, S3 = 0.00801 USDT.
• Resistance levels: R1 = 0.01995 USDT, R2 = 0.02279 USDT, R3 = 0.02592 USDT.
• Daily pivot (center) sits around 0.01682 USDT.
With that positive MACD crossover and RSI pushing into overbought levels, the near-term path seems tilted upward. The first real resistance zone we’re watching is between R1 and R2, roughly 0.01995 to 0.02279 USDT. If the momentum holds—maybe fueled by good news or strong trading volume—there’s a decent shot at hitting R3 around 0.02592 USDT within the next week or two.
On the flip side, if traders start taking profits or those token unlocks start weighing on sentiment, we’d expect a drop back toward the pivot level around 0.01682 USDT first, then potentially down to S1 near 0.01398 USDT. If we actually break below S1, things could get dicey, with a more extended pullback toward S2 around 0.01085 USDT becoming possible.
Scenario-Based Projections
Bull Case: Strong money flowing in from institutions or fresh positive news—think successful scaling or those big underwriting deals paying off—could send price blowing through R1 and R2. In this scenario, HUMA could realistically target the 0.0225 to 0.026 USDT range over the next week or two, maybe even higher if more good news drops.
Base Case: Price settles into a consolidation pattern between R1 (around 0.01995 USDT) and the pivot (roughly 0.01682 USDT), bouncing around as traders lock in their gains and the market catches its breath.
Bear Case: Those token unlocks hit or sentiment sours for some reason, causing price to get rejected at resistance and fall back toward the pivot or S1 near 0.01398 USDT. A really deep drop seems unlikely unless the broader crypto market takes a serious turn for the worse.
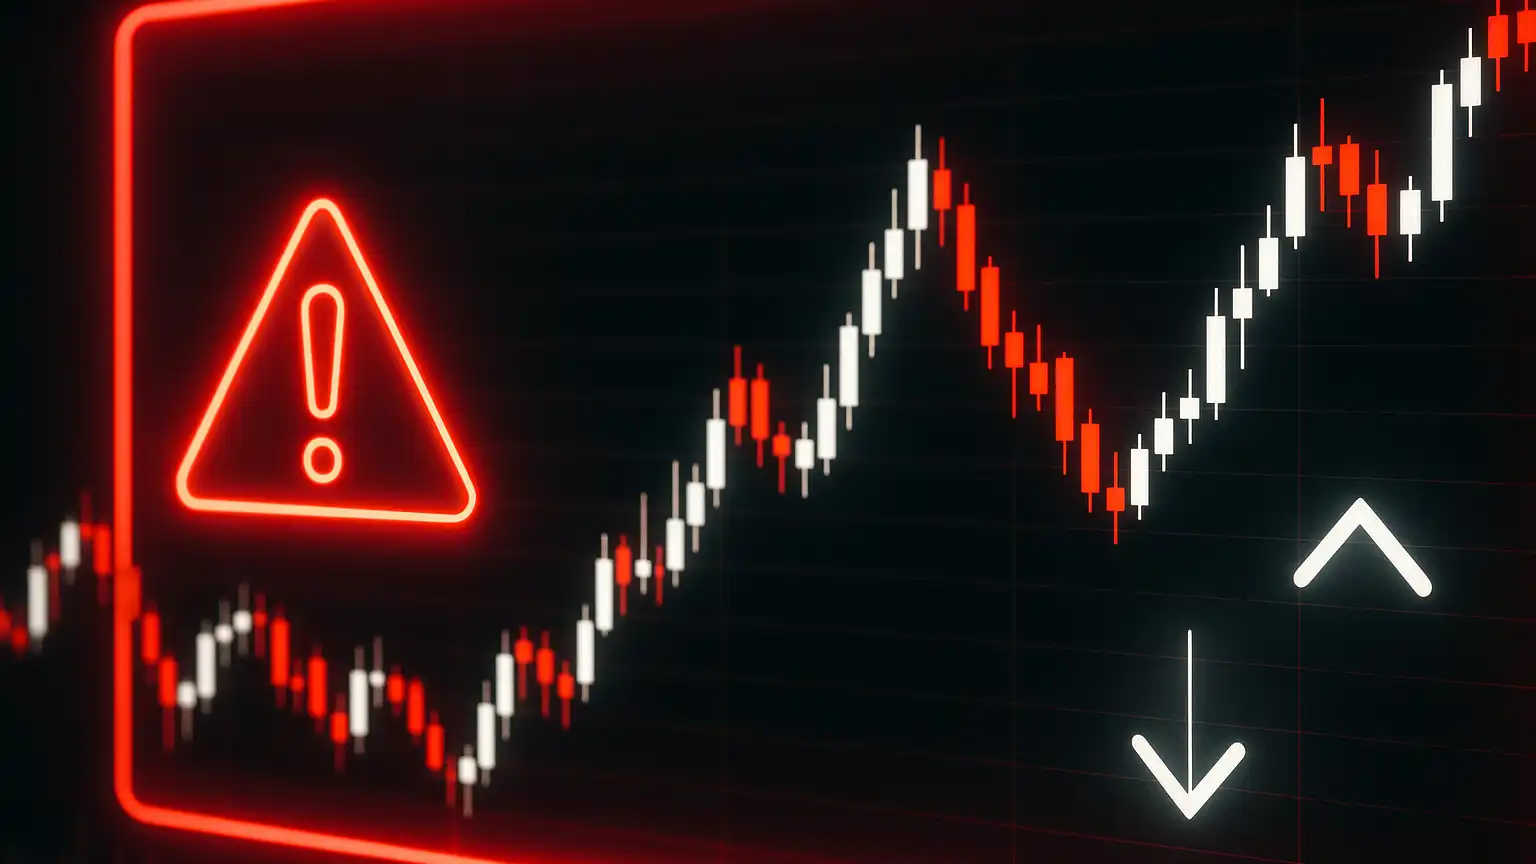
Recent Price Graphic & Visual Confirmation
The chart below shows the recent uptrend in action. You can clearly see how price is moving relative to those moving averages, and the resistance zones line up nicely with previous swing highs.
Risk Factors and Considerations
Let’s be real—no price prediction is guaranteed. Huma Finance is facing some genuine risks, both from inside and outside the project. Those major token unlocks could absolutely flood the market with supply, which would put a damper on price even if the technical picture looks rosy. Then there’s the regulatory wild card. Real-World Asset protocols are still in a gray area in many places, and any regulatory crackdowns in key markets could seriously chill the flow of capital into HUMA. On top of that, since Huma’s value proposition involves paying yields through USDC returns and payment financing, its fortunes are tied to broader macro factors like interest rates, stablecoin liquidity, and the credit quality of the real-world borrowers backing everything. And here’s one more thing to watch: sustained momentum needs to be backed by solid trading volume. If price is climbing on thin volume, that raises red flags about potential bull traps or false breakouts.
Outlook
All things considered, the technical picture right now leans bullish for the short term. If price can punch through that resistance around 0.01995 USDT with real conviction behind it, targets in the 0.0227 to 0.026 USDT range start looking pretty reasonable. But—and this is important—we need to stay cautious here. With RSI already overbought, those token unlocks looming, and the natural human tendency to take profits after a big run, there’s a very real chance we see a pullback toward the pivot or support zones. For active traders, it might make sense to take some profits off the table near R1 or R2, and definitely consider setting stop losses below the pivot or S1 to protect your downside. If you’re in this for the long haul, keep your eyes on the fundamentals—usage metrics, growth in credit origination, and whether those yield rates are sustainable. Those will tell you a lot more about HUMA’s future than any chart ever could.