
Recent Developments & Market Sentiment
The HOME token, which powers DeFi App, kicked off trading on major exchanges including Binance back on June 10, 2025. This launch brought a ton of attention and liquidity to the token. What’s catching people’s eyes is its value proposition—think gas-free swaps, cross-chain trading that doesn’t need bridges, and a straightforward non-custodial experience. The protocol has some interesting upgrades too, like a flywheel model where protocol fees get funneled back into buying HOME tokens, plus staking options that actually tie usage to token value. All of this is pulling in investor attention, though there are still some things to keep an eye on—mainly supply unlock schedules and volume-based fee subsidies that could shake things up.
Technical Indicators & Price Action Analysis
Right now, HOME is sitting at around $0.02987, up about 2.57% in the last day. Looking at the 4-hour chart, things are looking cautiously bullish:
- The 4-hour RSI is hovering around 66.09, which shows decent strength but is getting close to overbought territory. There’s still a bit of room to move up before we’d expect a pullback.
- The MACD is showing a bullish crossover—the MACD line (roughly 0.000558) is sitting above its signal line (about 0.000391), with a positive histogram around 0.000167. This tells us momentum is building on the upside.
- Price is trading comfortably above both the 4-hour Simple Moving Average (around $0.02818) and the Exponential Moving Average (near $0.02854), which reinforces that we’re in a short to medium-term bullish trend.
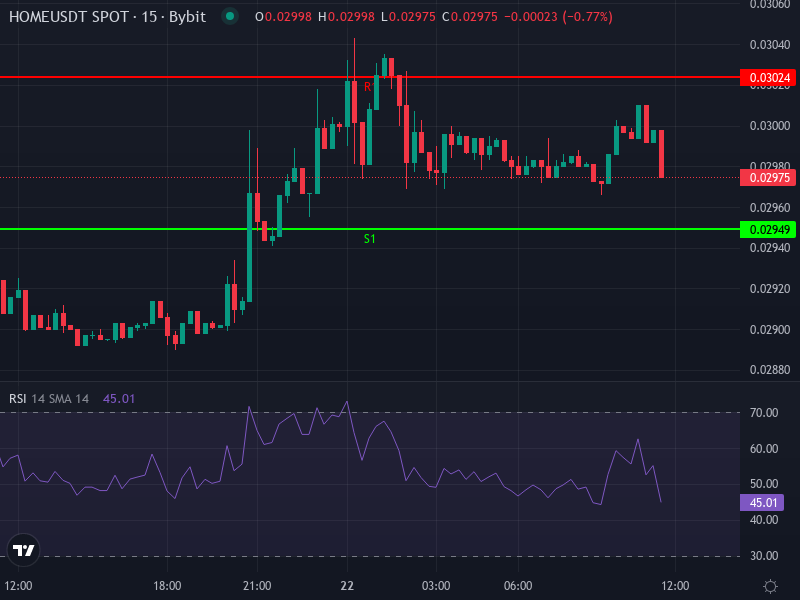
Looking at today’s pivot points from daily calculations, immediate resistance is showing up around $0.03024 (R1), then $0.03072 (R2), with stronger resistance at $0.03099 (R3). On the support side, we’re looking at levels near $0.02949 (S1), $0.02922 (S2), and deeper support at $0.02874 (S3). The rate of change over the past day is sitting at roughly +6.10%, which shows there’s heightened volatility and plenty of trader interest right now.
Short-to-Medium-Term Scenarios
Bullish Case: If HOME can stay above its moving averages—especially that 4-hour EMA around $0.02854—we could see it testing $0.03024 and potentially pushing toward the $0.03072-$0.03099 resistance zone. If it breaks above R2 with solid volume behind it, we might even see a move toward $0.032.
Bearish Case: If the price can’t hold above $0.02949, we could see it dropping back to $0.02922 and then $0.02874. A break below the 4-hour SMA (around $0.02818) would be a warning sign that we might see a sharper pullback, possibly down to $0.02800 or even a bit lower.
Strategic Takeaways & Forecast
HOME/USDT is in a pretty solid technical position right now. The positive MACD crossover, price trading above moving averages, and momentum confirmed by the RSI all point to potential upside in the near term. That said, those resistance zones—especially the $0.0305 to $0.0310 range—are going to be key. Breaking through them will need some serious volume.
Given that this token just launched recently and has a supply schedule in play, traders should keep a close watch on supply unlocks. These allocations gradually release HOME tokens over the next few quarters, and historically that kind of thing tends to create selling pressure. On the flip side, if the fee-flywheel keeps working and cross-chain usage grows, that could really support the bullish case.
Price Prediction Summary
Based on what we’re seeing in the indicators, a realistic outlook for the next week or two is range-bound trading between $0.0295 and $0.0310, with a slight lean toward the upside if that resistance around $0.0310 gets broken. If we do break through, a more aggressive target could be $0.0325. On the downside, if support fails around $0.0290 and especially $0.0285, we could be looking at a drop toward $0.0280 or lower.