Introduction: News Context and Market Sentiment
FTX Token (FTT) remains caught up in the aftermath of the exchange’s collapse, with ongoing legal battles and creditor repayment efforts still shaping its trajectory. Back in September 2025, the FTX bankruptcy estate green-lit a substantial creditor payout worth around $1.6 billion, which sparked some renewed hope among token holders that recovery might actually be happening. These developments have occasionally triggered brief spikes in trading activity, though the excitement rarely lasts. Market sentiment is pretty divided—some folks are clinging to any sign of progress, while most serious analysts remain doubtful about any meaningful price recovery given FTT’s murky utility and legal baggage. The technical picture hasn’t exactly been screaming “buy” either. In this piece, we’ll connect recent news to what the charts are telling us and try to figure out where price might be headed next.
Current Technical Indicators: Price, Momentum, and Trend
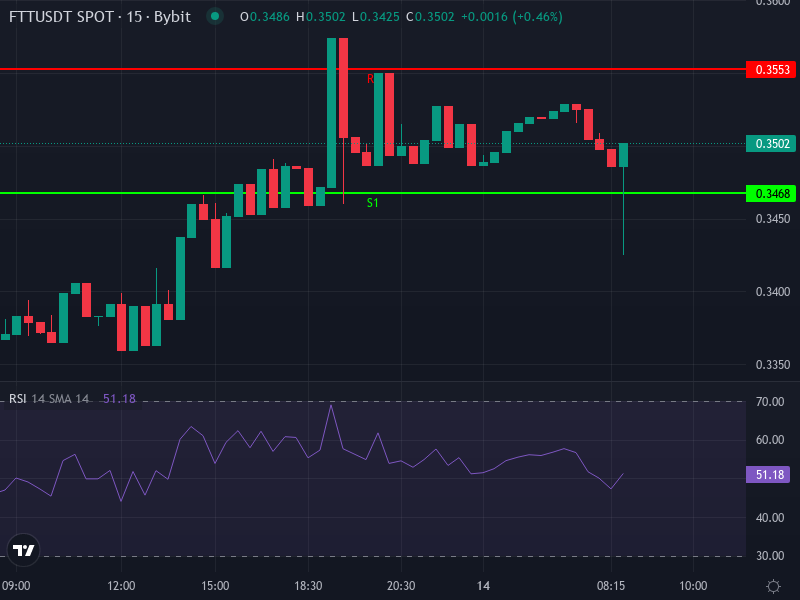
Right now, FTT/USDT is trading around 0.3496, up a solid 3.55% over the last 24 hours. Looking at the 4-hour chart, we’re seeing some moderately bullish signs:
- The RSI is hovering near 59.26, which puts it in that upper-neutral zone—there’s still headroom before things get overbought (that usually happens around 70).
- The MACD is showing a positive histogram, with the MACD line sitting at roughly 0.00606, above its signal at 0.00519. This points to some upward momentum, though it’s not exactly explosive. The histogram itself is about 0.00086—nothing to write home about yet.
- On the 4-hour timeframe, the SMA sits at approximately 0.33578 and the EMA at 0.33799. Since current price is above both, the short-term trend seems to favor buyers, though resistance could crop up as we move higher.
Daily pivot points give us some concrete levels to watch: the main pivot sits at around 0.35133, with resistance levels running from R1 at roughly 0.35527 all the way up to R3 at 0.36377. If things go south, support levels range from S1 at about 0.34677 down to S3 at 0.33827.
The longer-term view is less encouraging—sentiment data suggests around 83% of technical indicators are flashing bearish, with price sitting below several key long-term moving averages.
Key Technical Patterns and Levels
The fact that price is holding above those short-term moving averages suggests day traders and scalpers are finding opportunities on dips. The next real test is that R1 resistance around 0.3553—if price can punch through convincingly, we could see momentum toward R2 at 0.3598 and potentially R3 at 0.3638. On the flip side, if we fail to break R1 or the MACD starts losing steam, we’re probably looking at pullbacks toward S1 around 0.3468, maybe even S2 at 0.3428 or S3 at 0.3383.
Volatility is still running high based on ATR and other momentum gauges. The daily ADX shows some strength building, but the direction isn’t clear yet. We haven’t hit extreme oversold or overbought territory, which means there’s room for price to swing either way.
Price Forecast: Short- and Mid-Term Biases
Short-Term (next 1–4 weeks): FTT will probably trade in a range between roughly 0.34 and 0.36, with that R1 level around 0.3553 being the key battleground. If we manage to break above R2 at 0.3598, there’s a shot at reaching 0.36–0.3638, though sellers will likely show up around there. If we slip below S1 at 0.3468, things could get dicey, opening the door to S2 at 0.3428 and S3 at 0.3383, especially if the broader crypto market takes a hit.
Mid-Term (next 3–6 months): Unless something fundamentally changes—like actual utility returning, major exchange relistings, or a surprisingly favorable legal outcome—FTT is going to have a tough time sustaining any real gains. Some forecast models point to possible decline toward the $0.20–$0.30 range by mid-to-late 2026 if the bearish trend continues. That resistance zone near $0.40 is probably going to be tough to crack without serious volume backing it up.
Risks & Catalysts to Watch
Things that could move the needle include meaningful legal or regulatory developments (like new payouts or claim resolutions), sudden surges in trading volume or social media buzz, or—best case scenario—actual new uses for FTT. On the risk side, we’ve still got ongoing litigation, virtually no real utility, and the general volatility of the crypto market. The whole Sam Bankman-Fried saga has occasionally caused speculative pumps when he’s been in the news, but those spikes have been short-lived at best.
Final Insight
FTT is sitting at an interesting crossroads right now. The short-term technicals lean slightly bullish as long as that 0.355 resistance level gives way on decent volume. But zoom out a bit and the picture gets murkier—those longer-term moving averages are still overhead, and sentiment still leans bearish overall. If you’re trading this, treat any gains as potentially temporary, keep tight stop-losses below $0.34, and don’t kid yourself into thinking we’re heading back to the glory days without some major fundamental shifts.