Recent Context and Market Overview
FTT remains a magnet for speculative traders even as the shadow of FTX’s dramatic collapse continues to loom. The token has seen occasional price spikes tied to creditor repayment news and whispers about restructuring plans, but let’s be honest—none of these developments have fundamentally changed what FTT represents or restored genuine confidence in its long-term value. Meanwhile, the broader crypto market is wrestling with familiar demons: stubborn interest rates, skittish institutional money, and regulators who haven’t exactly rolled out the welcome mat. All of this makes it tough for riskier altcoins to catch a sustained bid.
Key Technical Indicators and Price Levels
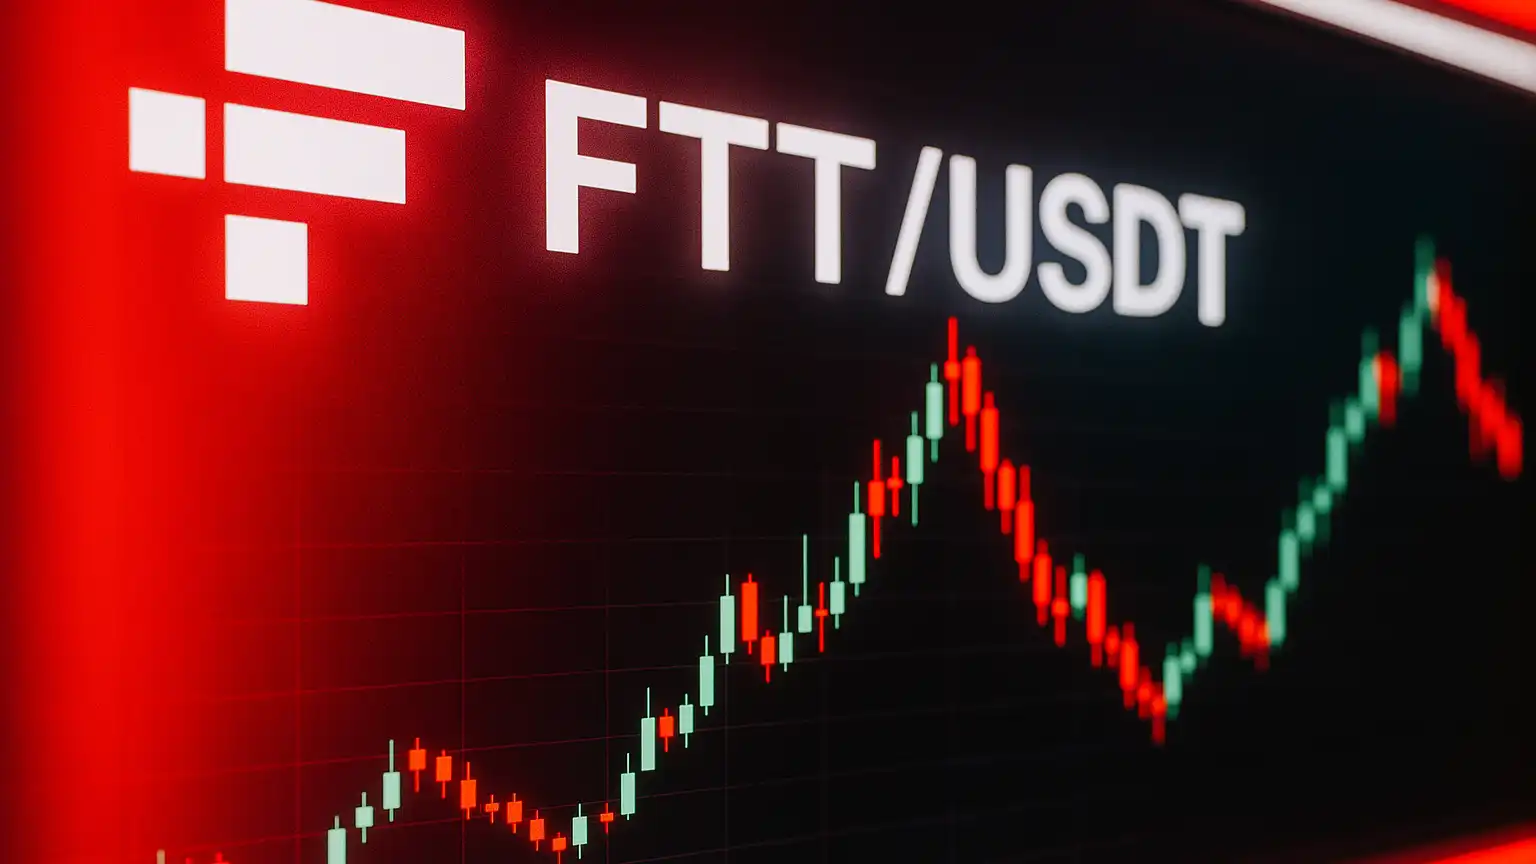
Right now, FTT/USDT is trading around $0.5518, up an eye-catching +14.74% over the past 24 hours. Before you get too excited, though, the technical picture tells a story that’s more nuanced than that headline number suggests. Looking at the 4-hour chart, the RSI sits at about 65.2—warm, but not quite overheated yet. The MACD is showing bullish momentum, with the MACD line sitting comfortably above its signal line and the histogram in positive territory.
The pivot analysis paints a clear battlefield: there’s a pivot point around $0.6324, with immediate support camping out at $0.4667 (S1) and a deeper safety net at $0.38097 (S2). On the resistance side, bulls will need to wrestle through $0.7181 (R1) before they can even think about testing $0.8838 (R2). The 4-hour moving averages are clustered between roughly $0.4864 (SMA) and $0.5015 (EMA)—a zone that’s currently acting as a launching pad for buyers trying to build something here.
Strengths and Weaknesses in the Technical Setup
Strengths: The MACD crossover and RSI behavior on shorter timeframes show genuine buying interest. The positive rate of change confirms that price isn’t just drifting higher—it’s accelerating. Trading above those short-term moving averages is also a small victory for bulls who’ve been beaten down for months.
Weaknesses: Zoom out to the daily chart, and things look less rosy. FTT remains firmly below both its 50-day and 200-day EMAs, which is textbook downtrend territory. Volatility is still elevated—the ATR suggests big swings are the norm, not the exception. Add to that oscillators like the CCI and Williams %R flirting with overbought levels, and you’ve got a recipe for potential pullbacks that could sting overenthusiastic longs.
Price Prediction: Possible Scenarios Based on Technical Zones
Let’s play out the tape with two realistic scenarios based on what the charts are actually showing right now.
Bullish Scenario:
If buyers can defend the $0.50-$0.52 zone and punch through resistance near $0.63, we could see FTT make a run toward the $0.70-$0.80 range where previous resistance meets longer-term moving averages. In a really strong market environment with solid volume behind it, there’s an outside shot at tagging $0.88 or higher. But that’s conditional on the entire crypto market catching fire, not just FTT doing its own thing.
Bearish Scenario:
Lose $0.50-$0.52, and things could get ugly quickly. First stop would likely be around $0.47, but if that doesn’t hold, we’re looking at a slide toward the more significant support around $0.38. That kind of move would probably need a catalyst—bad news on the legal front, macro shocks, or just general risk-off sentiment across crypto. If we do head down there, watch for RSI to hit oversold territory and for price to find footing near major EMAs where value hunters might step in.
Neutral/Marketplace Insight:
Here’s the thing: FTT is caught between two stories right now. Short-term momentum says “buy,” but the bigger picture is still flashing caution signs. Most moving averages lean toward a buy signal, yet plenty of other indicators are just shrugging their shoulders. Translation? We’re probably stuck in range-trading mode between roughly $0.50 and $0.70 unless something significant changes in the macro environment or with FTX’s situation.
Strategic Implications for Traders and Investors
If you’re looking to trade the short-term bounce, consider entering on strength above $0.55 but keep your stop-loss tight—just below those combined SMA/EMA zones we talked about. A clean breakout above $0.63 with decent volume could offer a nice risk-reward play toward $0.70, but don’t get greedy. This isn’t a token where you want to be throwing around oversized positions given how wild the swings can be.
For anyone thinking about longer-term holds, let’s pump the brakes. FTT doesn’t exactly have a compelling fundamental story beyond “maybe the restructuring goes well” and “maybe the legal stuff gets sorted.” Without regulatory clarity and with macro conditions still questionable across crypto, betting on sustained upside here is pretty speculative. Getting above $0.70 and staying there would require not just technical strength but a genuine shift in how the market views both FTX and risk assets generally.
Outlook Heading Into Q2 2026
Where FTT goes from here really comes down to forces bigger than the token itself. Interest rate decisions, whether institutional money starts flowing back into crypto, and how FTX’s legal saga unfolds—these are the things that’ll actually move the needle. If we get a crypto market recovery and risk appetite comes roaring back, altcoins like FTT could ride that wave and potentially challenge the $1.00 level. But if conditions stay choppy or deteriorate, FTT could easily get pinned down near current levels or drift lower toward those support zones we identified. Bottom line: keep your eyes on both the technical levels and the macro picture as we head deeper into 2026.