Recent Developments & Market Sentiment
FTX Token (FTT) is currently hovering around $0.3121 against USDT, sliding about 4.03% in the last 24 hours. Investors are keeping a close eye on the legal drama and bankruptcy proceedings tied to FTX’s spectacular collapse. Caroline Ellison, who used to run Alameda Research, just got out after spending 440 days behind bars—a development some folks think might help put this whole mess to rest and ease some of the uncertainty hanging over FTT. Meanwhile, Sam Bankman-Fried is still insisting FTX was never actually insolvent and that creditors are getting back anywhere from 119% to 143% of what they’re owed. These claims have sparked fresh debates about how the recovery is really going, and they’re definitely stirring up speculative interest in the token, even though FTT doesn’t really have much practical use anymore.
Technical Indicator Analysis
4-Hour Timeframe: Right now, FTT looks pretty beaten down. The 4-hour RSI is sitting at around 26.26, way under that classic 30 oversold line, which tells us selling pressure has been intense. The MACD line is at about –0.00977, sitting below its signal at –0.00879, with a negative histogram—basically, bearish momentum is still in charge, and any bounce we see might not have much staying power. On top of that, both the 4-hour SMA (around $0.3363) and EMA (about $0.3334) are sitting well above where the price is now, which just adds more weight pushing down.
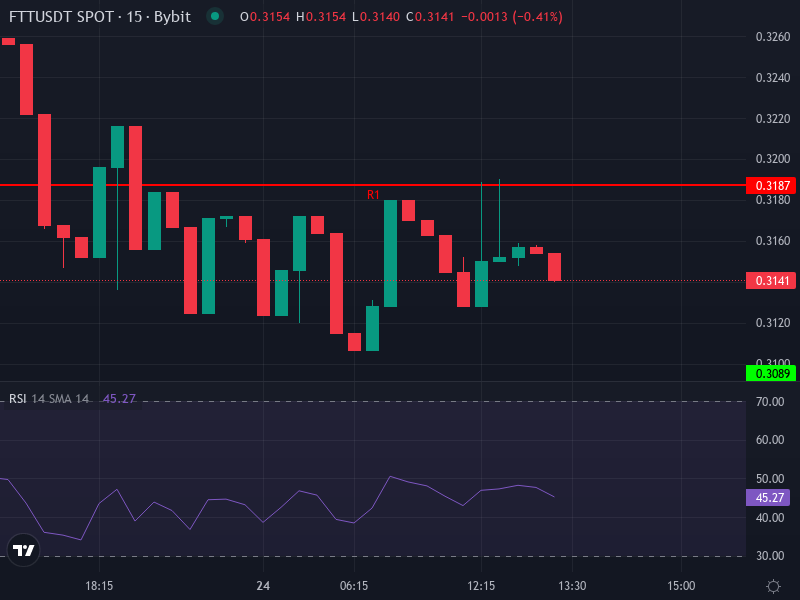
Daily Pivot Points: Looking at resistance, we’ve got R1 around $0.3187, R2 near $0.3244, and R3 at about $0.3285. Support levels are bunched up at S1 around $0.3089, S2 near $0.3048, and a bit deeper at S3 close to $0.2991. The daily pivot sits at roughly $0.3146. These are the spots to watch if you’re trying to catch an intraday bounce or anticipate further drops.
Short-Term & Mid-Term Price Forecasts
Taking the 4-hour technicals and pivot points into account, here’s what could happen with FTT/USDT over the next days and weeks:
- Bearish baseline: If FTT can’t push past that $0.3200 resistance zone (R1) and slips below support at $0.3089 (S1), we’re probably looking at a test of the $0.3000 level. Breaking through S2 around $0.3048 could open the door to S3 near $0.2991—unless something positive comes along to change the mood.
- Short-term bounce scenario: That oversold RSI does hint we might see a relief rally. If price can climb back above those moving averages in the $0.333–$0.336 zone, there’s a chance we could see a push toward $0.345 or so. But honestly, that’s going to take some good news or a real shift in sentiment to pull off.
- Mid-term outlook: Looking further out, the descending channel pattern and lack of real utility don’t paint a rosy picture. Some technical forecasts are putting FTT somewhere in the $0.22-$0.30 range by mid-2026 if things keep trending the way they are. There are resistance zones between $0.50 and $0.57 if we get a serious breakout attempt, but getting back above a dollar seems pretty unlikely without some major changes or a real relaunch of the token’s purpose.
Risk Factors & Key Catalysts
There’s plenty that could knock this around. More legal news—especially anything about insolvency or clawback claims—could shake things up. Big sell-offs from creditors or recovery trusts are always a possibility, and let’s face it, FTT doesn’t really have much of a use case right now for retail or institutional players. On the flip side, things that could trigger spikes include actual creditor payout dates, new info from the bankruptcy process, or any credible word about FTT getting relisted or restructured with some kind of real utility. Sam Bankman-Fried’s statements still move the needle short-term on social media, but those reactions tend to fade pretty quickly.
Price Prediction Summary
When you put together the technical indicators, the legal situation, and the forecast models, a realistic short-term range for FTT/USDT looks like $0.30 to $0.35. If resistance holds and there’s no positive catalyst, breaking below $0.3000 and testing around $0.2990 is definitely on the table. For any real upside breakout to happen, we’d need to see price clear that $0.335–$0.340 zone with solid volume behind it. Looking ahead through 2026, there’s potential for more downside toward the $0.20-$0.25 range unless creditor repayments or legal clarity actually improve how people feel about this token. Those more optimistic scenarios pushing toward $0.50 and beyond? They’re going to need some major structural changes that we’re just not seeing in the cards right now.