
Current Landscape & Key Drivers
EthereumPoW (ETHW/USDT) is currently trading around $0.34414, down 3.13% over the last 24 hours. The token has been struggling lately, weighed down by the broader crypto market’s cautious mood, reduced institutional interest, and thinning liquidity that’s creating a clear downward trend. The 24-hour low touched $0.3421, and over the past month, ETHW has dropped roughly 30-35%—a pretty painful decline for holders.
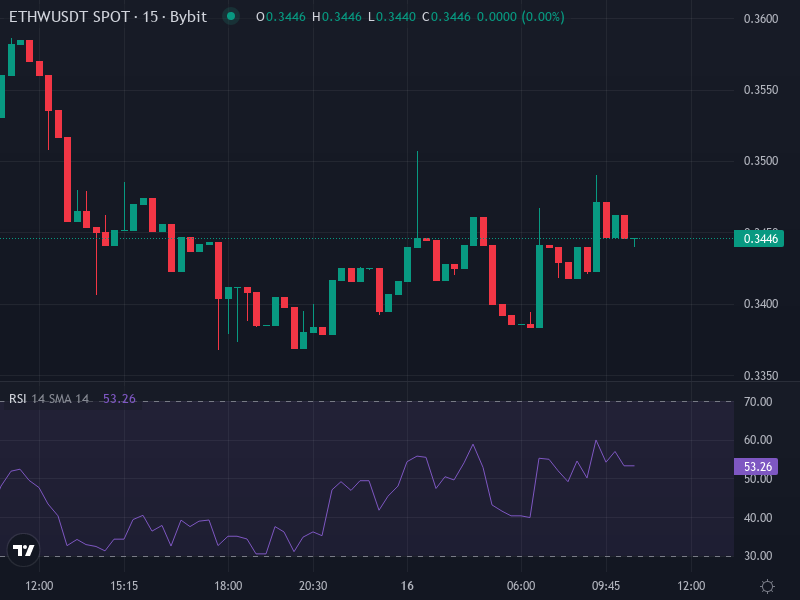
Part of what’s driving this weakness comes from spillover effects tied to Ethereum-related assets and their ETF flows. Large redemptions in instruments connected to ETHW have added fuel to the selling fire. From a technical standpoint, things look equally rough: the Relative Strength Index (RSI) has fallen into deeply oversold territory below 30, and the price is sitting well beneath all the major moving averages—the 7-day, 30-day, and 50-day lines. All of this confirms that bearish momentum is very much in control right now.
Technical Indicators & Short-Term Price Behavior
Several indicators are flashing that ETHW is oversold. The 14-day RSI is hovering around 28–30, which suggests sellers might be getting exhausted, though that doesn’t automatically mean we’re about to see a reversal. The MACD remains negative with histogram bars trending downward, and we haven’t seen that bullish crossover yet—meaning the downward pressure is still hanging around.
Looking at moving averages, they’re acting as clear resistance levels above the current price. Both the 50-day and 200-day moving averages sit well overhead, reinforcing the bearish picture. Even the shorter-term averages (7-day to 20-day) are acting as hurdles, so any bounce attempt will have to push through these zones before we can talk about real strength returning. On the support side, there are a few key levels to watch: $0.3153, $0.3052, and especially $0.2960. For resistance, the first barrier is at $0.3346, followed by $0.3439 and $0.3540.
Price Scenarios & Predictions
Based on where we are technically and what the market’s telling us, there are two main paths ETHW could take from here:
- Bearish continuation: If ETHW can’t break back above that $0.3346–$0.3540 resistance zone—and stays pinned below its short-term moving averages—there’s a real risk of further downside. Losing support at $0.3153 could open the door to a move toward $0.30, and potentially lower if volumes stay weak or sentiment gets worse.
- Moderate rebound: There’s also a chance we see a relief bounce from these oversold levels, especially around the $0.305–$0.315 support zone. For this to turn into anything meaningful though, ETHW would need to punch through $0.3346 with solid volume behind it. If that happens, we could see a test of $0.3540 and maybe even a revisit of $0.40—though getting much higher would require broader market support and improved fundamentals.
Key Levels to Monitor
Support zones: $0.3153 → $0.3052 → $0.2960.
Resistance zones: $0.3346 → $0.3439 → $0.3540.
Indicators worth watching: RSI divergence or recovery above 30-35; MACD crossovers; movement above short-term EMAs; volume increases on up days.
Broader Implications for Investors
For active traders, ETHW is definitely a higher-risk play with plenty of volatility. If you’re thinking about entering long positions near these strong support levels, the risk-reward might look attractive—but you’ll want tight stop-losses given the weak liquidity and potential for sudden drops. For anyone holding medium-term, the reality is that unless ETHW can reclaim its short and mid-term moving averages and hold support above $0.30, the bearish outlook remains the dominant story.
From a fundamental perspective, ETHW’s narrative isn’t particularly strong right now. Delistings from major exchanges, low institutional confidence, and broader crypto market headwinds all mean that even if we see technical bounces, they might not last unless there’s actual positive news or real development in the ecosystem to support them.
Outlook Summary
Bottom line: ETHW is technically oversold and trading well below its moving averages, facing resistance just overhead. In the near term, unless we see a clear break above roughly $0.3346 with strong momentum behind it, the bias leans toward more downside—possibly testing $0.30 or lower. If we do get a bounce, keep an eye on whether it can reclaim those short-term averages with decent volume. That would be your signal that maybe, just maybe, a more sustainable recovery is taking shape.