Recent Developments & Sentiment Catalysts
Late 2025 brought some pretty significant changes to dYdX that are still playing out in the market. The community voted through a buyback program that funnels 25% of protocol fees into buying DYDX tokens off the open market. This should help reduce supply floating around while aligning incentives better for token holders. Plus, the platform finished its move away from Ethereum onto its own Cosmos-based chain, which cleaned up a lot of the supply confusion and seems to have given long-term holders more confidence.
That said, competition in the perpetuals space is getting fierce. You’ve got new platforms coming in with faster execution and attractive fee structures eating into dYdX’s dominance. The team’s response has been to double down on liquidity rewards through their Surge program and roll out more spot trading pairs for major coins. On the regulatory front, there’s a commitment to enter the U.S. market by the end of 2025—though that’s just spot trading for now, since perpetuals are still waiting on clearer rules. All these moving parts create both opportunities and potential pitfalls for where the price heads next.
Technical Structure: Support, Resistance, and Momentum
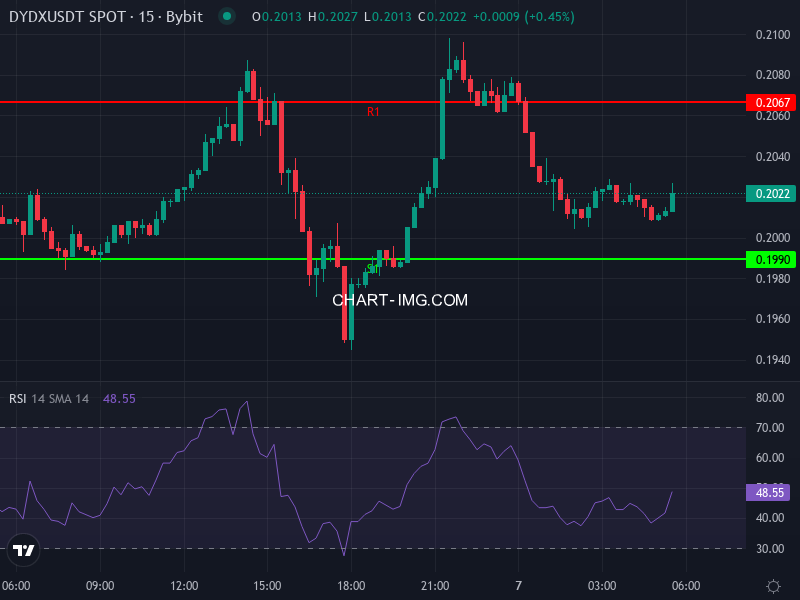
DYDX is trading around $0.2019 right now, up slightly over the past day. Looking at the 4-hour chart, the RSI is sitting at about 58—nothing extreme, just mildly bullish. The MACD tells a slightly different story though: there’s a small bearish crossover happening, with the histogram dipping into negative territory around -0.00048. That suggests the recent buying momentum might be cooling off a bit. The 4-hour moving averages are holding up as support, with the SMA near 0.19646 and EMA around 0.19569.
The daily pivot analysis gives us some useful reference points. The main pivot is at roughly 0.20343. First resistance comes in at about 0.20667, with a second layer near 0.21113. On the downside, initial support sits around 0.19897, followed by deeper cushions at 0.19573 and 0.19127. These levels matter whether you’re day-trading the swings or trying to time a longer-term entry. The overall technical picture leans bullish based on moving averages, though oscillators are more mixed—and the volatility indicators are flashing warnings that quick moves in either direction are definitely on the table.
Patterns and Risk Points
Even with the modest uptick in momentum, that weakening MACD histogram is worth watching. Without fresh buying interest, we could easily see a retest of those support levels. The resistance zone between roughly 0.2067 and 0.2111 is the line in the sand—breaking through there with real volume is what bulls need to see for any meaningful upside. There’s also the ongoing token unlock schedule to consider. Past unlocks have capped rallies before, so unless those emissions get adjusted or absorbed by demand, they’ll keep acting as a ceiling on price.
Price Projection Scenarios Into Q1 2026
If things break the right way—think broader crypto strength, the buyback program proving effective, and some positive regulatory news—DYDX could push through that 0.2067 resistance. From there, the next meaningful target would be the R2 zone around $0.21 to $0.215. In a particularly strong scenario, we might even see a run toward $0.23, though that would need both volume and sentiment really firing on all cylinders. Holding above that daily pivot near $0.2034 will be critical for any bullish case to play out.
On the flip side, if resistance holds or selling pressure picks up—maybe from those token unlocks or broader market weakness—we’re looking at potential downside. The first support zone between $0.1957 and $0.1989 should catch initial dips. If that breaks, the next stop would be around $0.191 to $0.190, especially during thin liquidity periods. Anyone trading this should definitely use tight stops, particularly if you’re buying near resistance without clear confirmation that buyers are actually stepping up.