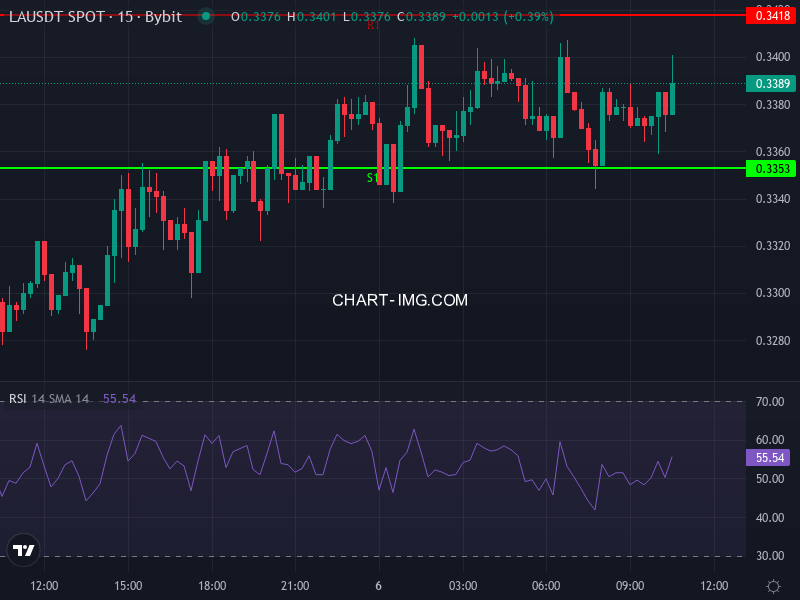
Current Market Snapshot & Recent Developments
Lagrange (ticker: LA/USDT) is currently trading around $0.3380, up about +2.10% over the past 24 hours. The token is sitting just above its daily pivot point of roughly $0.3379. We’re looking at resistance levels at $0.3418 (R1), $0.3444 (R2), and $0.3483 (R3), with support zones at $0.3353 (S1), $0.3314 (S2), and $0.3288 (S3).
On the fundamental side, there’s been quite a bit of activity in LA’s ecosystem lately. The team rolled out a community airdrop, launched staking and delegation through EigenLayer, and got listed on several major exchanges like KuCoin, Bitget, and Bitso. While these developments have definitely increased visibility for the project, they’ve also created some short-term selling pressure due to token unlocks and the inflationary nature of the tokenomics.
Technical Indicators & Chart-Based Interpretation
When we dig into the short- to mid-term technical picture, LA is showing some strength but there are signs it might be losing steam. On the 4-hour chart, the Relative Strength Index (RSI) is hovering around 64.4, which suggests decent bullish momentum without being in overbought territory yet. The MACD on the same timeframe tells a slightly different story—the main line is sitting just below its signal line with a small negative histogram reading. This hints that upside momentum might be weakening or that we could see some consolidation soon.
Right now, the price is trading above both the 4-hour Simple Moving Average (SMA) at about $0.3277 and the Exponential Moving Average (EMA) at roughly $0.3271, which is a positive sign for the short-term trend. As long as the price stays above these moving averages, the bullish structure remains intact. That said, history shows us that after big surges driven by listings or airdrops, LA has tended to pull back sharply—usually when early recipients start selling or when liquidity dries up.
Price Prediction & Scenarios
Baseline Bullish Case
If LA can hold the $0.327–$0.335 support zone (which sits just above those 4-hour moving averages) and we see trading volume pick up, there’s a decent shot at a move toward the first resistance around $0.3418. Break through that level, and we could see a push toward R2 at roughly $0.3444, with further upside potentially reaching $0.3483. For this scenario to play out, we’d need to see strong demand growth for the ZK Prover Network, good uptake on the staking program, and hopefully some restraint on those supply unlocks.
Bearish or Sideways Outcome
On the flip side, if LA fails to hold above that SMA/EMA band around $0.327—especially if volume starts to fade—we could see a drop toward daily support near $0.3314 or $0.3288. If the price breaks below $0.3288, we might be looking at a test of the $0.310–$0.300 range, particularly if those supply unlocks start adding selling pressure. In a scenario like this, the RSI would likely fall toward oversold levels (below 30), which historically has triggered short-term bounces—though these haven’t necessarily led to strong trend reversals without new catalysts to drive interest.
Key Variables & Risk Factors to Monitor
– Supply unlocks & inflation: Keep an eye on when unlocked tokens hit exchanges. The 4% annual inflation rate could create a consistent headwind on price unless it’s offset by strong demand for proofs or some kind of buyback program. Watch exchange wallets and foundation addresses around unlock dates.
– Proof demand trajectory: Whether LA sees growing usage for AI verification, rollup services, or ZK coprocessing will be crucial for token utility and buying pressure.
– Volume trends: Strong trading volume confirms that price moves are legitimate. Weak volume often signals failed breakouts or exhausted trends.
– Macro sentiment: The broader crypto market environment—particularly Bitcoin dominance and overall appetite for altcoins—will have a big impact on how LA trades. If sentiment turns negative across the market, LA could see amplified downside.
– Moving average behavior: As long as price stays above those 4-hour and 1-day SMAs and EMAs, the bullish outlook stays intact. A breakdown below these levels would weaken confidence in further upside.