
Current Context & Fundamental Drivers
HOME token—the governance and utility token powering Defi App—has been picking up steam lately, thanks to an aggressive buyback program and some solid product updates. The team’s been putting roughly 80% of protocol revenue straight into buybacks, with a notable 2.4 million HOME token withdrawal just last week alone. This kind of activity naturally creates a deflationary supply dynamic that tends to get holders excited. On top of that, we’ve seen the Android app roll out alongside a $1 million trading competition, both of which have really pumped up trading volumes and brought new users into the ecosystem. Looking ahead, the roadmap includes some interesting developments like tiered staking options, on-chain governance features, and something they’re calling “protocol bribes”—all designed to make HOME more useful and, hopefully, more in-demand.
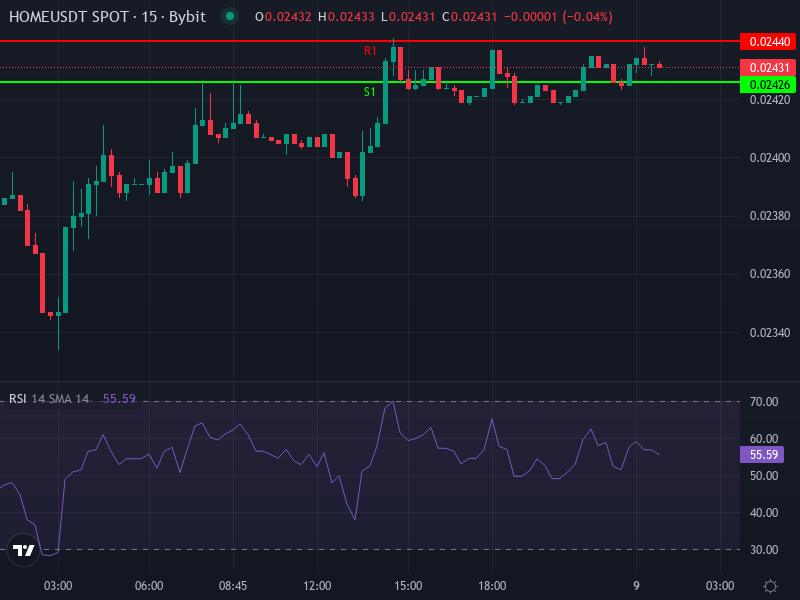
Technical Profile: Indicators, Levels & Momentum
Right now, HOME/USDT is trading around $0.024276, up about 2.14% over the last 24 hours. When we look at the 4-hour chart, the key moving averages paint a pretty straightforward picture: the Simple Moving Average sits at roughly $0.024188, while the Exponential Moving Average comes in just below at $0.024118. The Relative Strength Index is hovering around 53.95, which basically means we’re in neutral-to-slightly-bullish territory—nothing overheated yet, which is actually a good sign for potential upside.
What’s particularly interesting is the MACD on this timeframe. We’ve recently seen a bullish crossover, with the MACD line crossing above the signal line and the histogram turning positive (sitting at about +0.0000269). This suggests momentum is shifting upward. As for pivot levels, immediate resistance shows up around $0.02454, with R2 and R1 just underneath. On the support side, we’ve got a cluster of levels between roughly $0.02426 down to $0.02412 that should catch any dips.
Short-Term & Mid-Term Price Scenarios
Let’s break down two realistic scenarios for where HOME might be headed over the next few days and weeks, based on what the charts are telling us right now:
Bullish Case
- If HOME manages to stay above that daily pivot around $0.02433 and keeps building on the momentum from the MACD crossover and moderate RSI, we’re looking at an initial upside target near $0.02454. Push through $0.02475, and suddenly the path opens up toward $0.0254, which lines up nicely with what some analysts are calling the 23.6% Fibonacci retracement level.
- The ongoing buyback program combined with those upcoming staking upgrades—think tiered systems with locked periods—could really amplify demand while simultaneously tightening supply. If trading volume stays healthy, these fundamentals might be enough to carry HOME into the $0.0255–$0.0260 range over the medium term, assuming resistance levels get decisively broken.
Bearish Case / Risk Points
- On the flip side, if HOME can’t hold above that $0.02433 pivot and slips below the support zone around $0.02426–$0.02419, we could see a pullback toward $0.0240, maybe even stretching down to $0.0238. What could trigger this? Maybe the buybacks slow down, or people start taking profits after all the roadmap hype, or we just see broader crypto market weakness dragging things down.
- Anyone jumping in late trying to chase momentum should be aware that resistance at $0.02454 could prove pretty stubborn. If price action stalls there, we might see sideways consolidation or even a minor retreat. Weak volume during any breakout attempt would be a red flag that the move might not have legs.
Outlook & Key Variables to Watch
For anyone tracking HOME—whether you’re trading or just keeping it on your watchlist—here are the critical factors that’ll likely determine which way this thing goes:
- Execution matters. The team needs to actually deliver on those roadmap promises, especially the advanced staking features, protocol bribes mechanism, and that on-chain governance portal. Any delays or vague communications could quickly sour sentiment and stall momentum.
- Keep an eye on volume trends, both on the exchange and in terms of actual app usage. The Android launch and trading contests should be driving user activity—if we see that sustained, it validates the demand story. But if volume starts drying up, those breakout attempts probably won’t stick.
- The relationship between buybacks and token emissions from staking rewards is crucial. If the buyback program consistently outpaces new supply hitting the market, that supply squeeze will continue supporting upward price pressure.
- Don’t forget the macro picture. Bitcoin’s movements, overall risk appetite in crypto markets, and rotation between large-caps and altcoins all matter here. HOME’s relatively small market cap makes it more sensitive to these broader market forces, so even great fundamentals can get overwhelmed if the market turns sour.
Bottom line: if current support levels hold and the catalysts we’ve discussed actually materialize, HOME has a reasonable shot at testing the $0.025–$0.026 zone in the coming weeks. If things don’t pan out, though, a retreat toward $0.0238–$0.0240 is a perfectly reasonable downside scenario to plan for. Whatever your position, make sure your allocation sizes and stop-loss levels account for the volatility inherent in tokens like this.