
Current Market Conditions & Macro Drivers
Right now, Creditcoin (CTC/USDT) is trading around $0.2977, which represents a small increase of roughly 1.74% in the last 24 hours. While we’re seeing a bit of positive movement in the short term, the bigger picture tells a different story. Most technical indicators—things like moving averages and momentum oscillators—are showing either bearish or neutral signals. The MACD and ADX readings, for instance, aren’t giving us much confidence that a strong trend is forming. Basically, the market seems uncertain and stuck in wait-and-see mode rather than making any bold moves.
When it comes to the fundamentals, there’s definitely some interesting stuff happening. CTC holders are getting excited about potential ecosystem growth, especially with upcoming DePIN partnerships and the Spacecoin airdrop that’s supposed to reward token holders. That said, it’s not all sunshine and rainbows. There are real concerns about liquidity drying up after some exchanges delisted margin trading for CTC, plus there are token unlocks on the horizon that could flood the market with more supply. So we’ve got this tug-of-war between hopeful catalysts and legitimate risks that’s keeping things unpredictable.
Technical Indicators & Support / Resistance Analysis
If you look across different technical analysis tools, they’re pretty much in agreement that Creditcoin is facing downward pressure right now, even though some indicators are starting to hint at oversold conditions. When you zoom out to the daily and weekly charts, moving averages are sitting above the current price, which creates a ceiling around the $0.30–$0.32 area. The RSI is hanging out in neutral-to-slightly-oversold territory, but it hasn’t given us a clear signal that a reversal is coming. The MACD and Williams %R are still leaning toward the sell side, which means we’d need something significant to happen before the momentum shifts.
On the downside, there’s solid support between $0.28 and $0.26, with another safety net down around $0.23 if things get worse. On the upside, resistance is clustered near $0.32 to $0.35, where previous highs and moving averages are creating obstacles. If CTC can push through $0.32–$0.33, that would be a real signal that bulls are taking control. But if it drops below $0.26, we could see a quicker slide down to those lower support levels where bargain hunters might start to show up.
Price Predictions: Short-to-Long Term Scenarios
Looking ahead, there are a few ways this could play out depending on what happens with the market and CTC’s fundamentals:
Bullish Scenario (3-6 months)
If things go well—like the Spacecoin airdrop creating buzz, DePIN partnerships actually delivering results, or CTC getting listed on better exchanges—we could see the price climb toward $0.40 to $0.60. Breaking above $0.35 would be the first sign that buyers are serious, and pushing past $0.50 could take us back toward the highs we saw earlier this year. In this scenario, you’d expect the MACD to flip positive, RSI to climb into overbought territory, and generally see technical momentum confirming the upward move.
Base Case Scenario (1-3 months)
If nothing major happens in either direction, CTC will probably just trade sideways between $0.28 and $0.33. The $0.32–$0.33 resistance would keep a lid on rallies, while support around $0.26 to $0.28 would catch any dips. During this time, expect choppy, rangebound trading driven more by emotion and speculation than any clear trend. Moving averages would start to flatten out, oscillators would stay neutral, and volatility wouldn’t be too crazy.
Bearish Scenario (Lower Risk Triggers)
If bad news hits—maybe the Spacecoin airdrop disappoints, liquidity problems get worse, or the overall crypto market takes a dive—CTC could fall to $0.23–$0.25 pretty quickly. Breaking below $0.23 might push it down toward $0.20, though that’s probably where long-term believers would start buying again. In this situation, technical indicators would look pretty rough: MACD diving deeper into negative territory, RSI showing more severe oversold conditions, and moving averages pulling further away from the price.
Price Chart & Key Levels Visualization
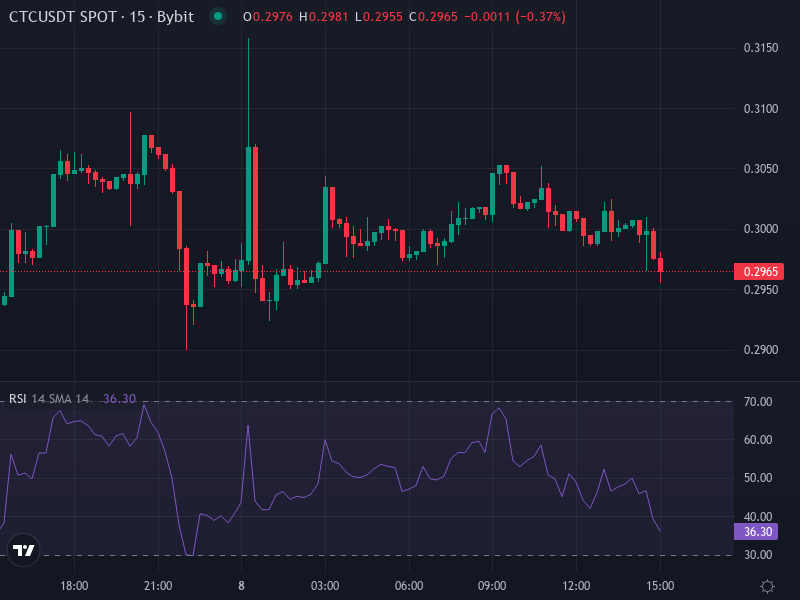
The chart shows the important areas to watch: resistance starting around $0.32–$0.35, a pivot zone near $0.30, and support structure between $0.26 and $0.23. How the price behaves around these levels will probably determine where CTC heads next.