Macro Context & Recent Catalyst
Compound protocol recently found itself in hot water after a bug in its Comptroller module accidentally sent out roughly 280,000 COMP tokens as excess rewards. The good news? User funds in borrow and lending positions remained safe. Still, the market didn’t take it well—the price tanked by as much as 15% before clawing back some of those losses.
From a technical perspective, things are a bit messy right now. Some analysts are pointing out that COMP looks oversold, with the RSI dropping near or below 30 on daily charts—typically a sign that a bounce might be brewing. That said, the overall trend is still pretty bearish. Both the 50 and 200-period moving averages are sitting above current prices, which means bulls still have their work cut out for them.
Technical Indicator Synthesis from Short- to Mid-Term
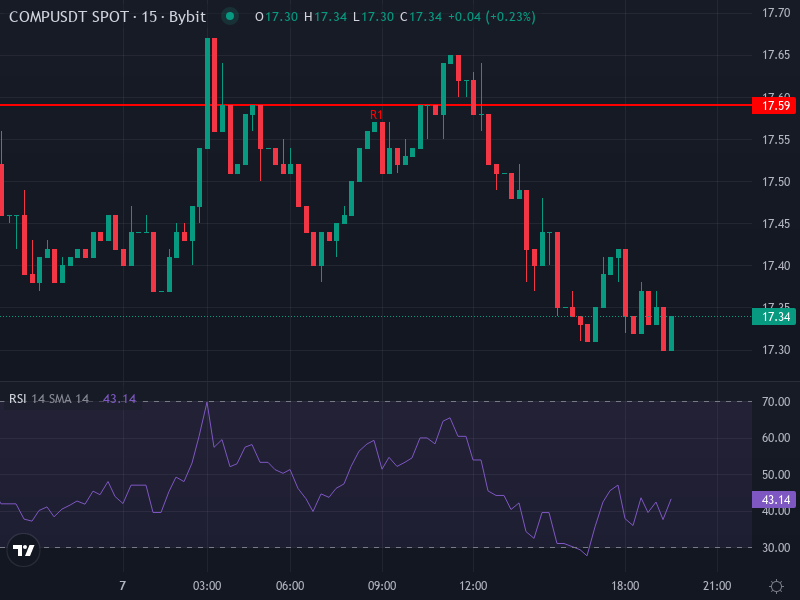
Right now, COMP/USDT is trading around $17.38, down about 0.38 over the last 24 hours. Looking at the 4-hour chart, the Simple Moving Average is hovering around $17.71 and the Exponential Moving Average sits near $17.75. The MACD is showing some weakness—it’s slightly negative with the signal line sitting above the histogram, which basically screams “bearish momentum.” Meanwhile, the 4-hour RSI is hanging around 41.75, which suggests some weakness without being completely oversold just yet.
When we dig into the daily pivot points, major support appears to be camped between $17.08 and $17.23, while resistance levels are stacked between roughly $17.59 and $17.95. The central pivot sits right around $17.44. If we see a breakdown below that $17.08 support, things could get ugly fast—potentially sliding toward $16.87 or even lower.
Short-Term Scenarios (Next 24-72 hours)
– Bearish scenario: If COMP can’t push past that 4-hour EMA around $17.75 and breaks through the resistance zone between $17.60 and $18.00, we could see sellers pile on. That would likely drive the price down toward the $17.08 support level, possibly even testing $16.87.
– Bullish scenario: On the flip side, if price manages to break cleanly above $17.80–$18.00 and actually hold there, we might see momentum start to shift. That could open the door to testing resistance around $17.80 to $17.95. For this to really stick, we’d need to see the MACD histogram flip positive.
Mid-Term Implications & Price Forecast
Here’s where it gets interesting. The daily RSI is pretty oversold, and there’s solid support sitting in that $17.00–$17.20 zone. If no new bad news drops, there’s a decent shot we could see a relief bounce over the next week or so. But let’s be real—that resistance between $17.60 and $18.00 is going to be tough to crack.
If support at $17.08 fails, things could accelerate to the downside pretty quickly. We might see a drop toward the $16.50–$16.80 range, especially if momentum indicators keep sliding (MACD trending lower, RSI hitting oversold territory). On the other hand, a decisive break above $18.00 with decent volume could open up a run toward $18.50–$19.00, though there’s likely to be strong resistance waiting above that.
Of course, there are plenty of wildcards. More protocol hiccups, broader DeFi sell-offs, or macro headwinds could all weigh on price. On the positive side, renewed interest in DeFi, constructive governance moves from Compound, or new exchange listings could provide fuel for upside.
Projected Price Bands by Time Horizon
– Next 24–72 hours: We’re probably looking at a range between $17.05 and $17.90, depending mostly on whether COMP can break through that resistance near $17.75.
– Next 5–7 days: If we get a breakout, $18.50–$19.00 could come into play. If support cracks, we might be looking at a slide toward $16.50.
– Next 1–2 weeks: If market conditions settle down and buyers show up, there’s an outside chance we could test $19.50 or even take a run at the psychological $20 level. If bears stay in control, we could end up consolidating down in the $15–$16 range.